Integrated Student Records: A Guide for Higher Ed Data Leaders
The student data already exists. It’s just scattered across a dozen systems that don’t talk to each other. Here’s how integrated student records fix that — and why they’ve become the foundation of modern student success.
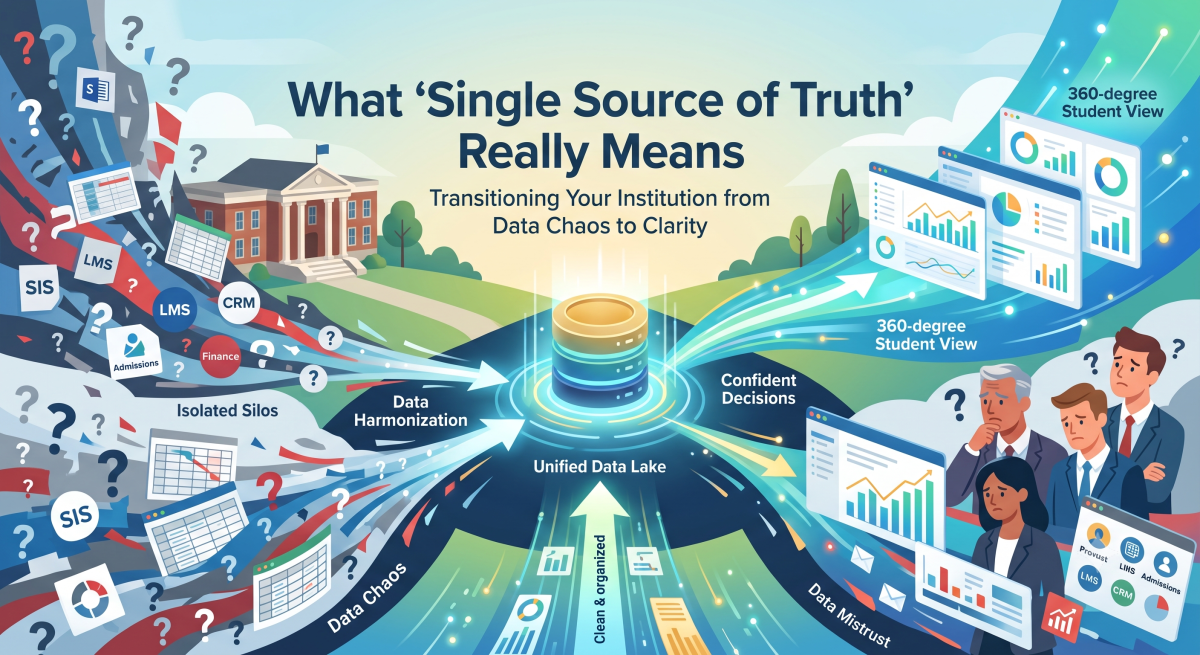
Walk into almost any institution and you’ll find the same problem: a student’s story is split across the SIS, the LMS, the CRM, financial aid, advising notes, and a handful of spreadsheets nobody fully trusts. Each system holds a fragment. None holds the whole. When an advisor, a registrar, or a provost needs a complete picture of a learner, they end up stitching it together by hand — if they can get it at all.
Integrated student records solve that fragmentation by unifying data from every source into a single, reliable, and governed view of each student. This guide explains what integrated student records are, why they matter for retention and enrollment, the challenges of building them, and the practical steps higher education institutions take to get there.
What Are Integrated Student Records?
An integrated student record is a unified, continuously updated profile of a learner that pulls together data from across the institution’s systems — academic, financial, behavioral, and demographic — into one coherent view. Rather than living as disconnected entries in separate platforms, the data is harmonized so that a single record reflects the student’s complete journey.
This is distinct from a single student information system. An integrated data approach sits above and across your existing tools, drawing from each rather than replacing them. The goal is not another silo — it’s a connective layer that makes the systems you already own work together.
Integrated Student Records vs. a Student Information System (SIS)
A student information system manages core administrative functions: enrollment, registration, grades, and transcripts. It’s essential infrastructure, but it captures only part of the picture. Integrated student records combine SIS data with information from the learning management system, the CRM, financial aid, and other sources — producing a 360-degree view that no single SIS delivers on its own.
What Data Sources Feed an Integrated Student Record?
A genuinely integrated record draws from the full landscape of campus systems, typically including:
- Student Information System (SIS): enrollment status, course history, grades, transcripts, and degree progress.
- Learning Management System (LMS): engagement, assignment submission, participation, and early academic signals.
- CRM and admissions platforms: recruitment, application, and communication history.
- Financial aid and student accounts: aid packages, balances, and holds that influence persistence.
- Advising, retention, and co-curricular systems: notes, interventions, and engagement beyond the classroom.
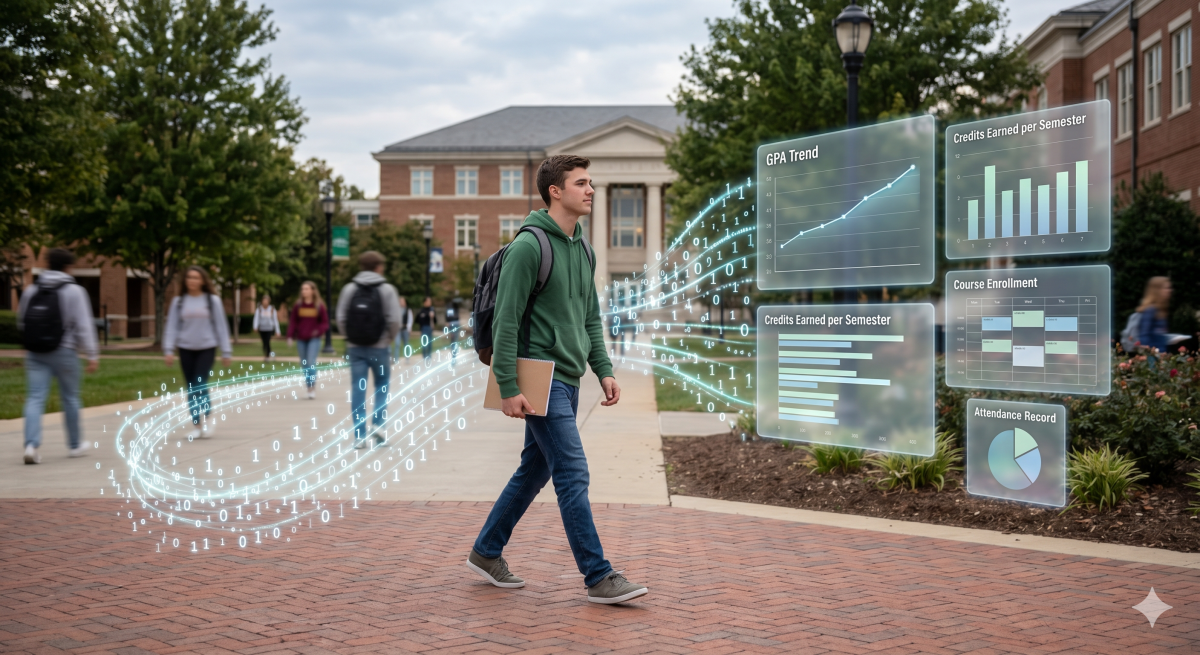
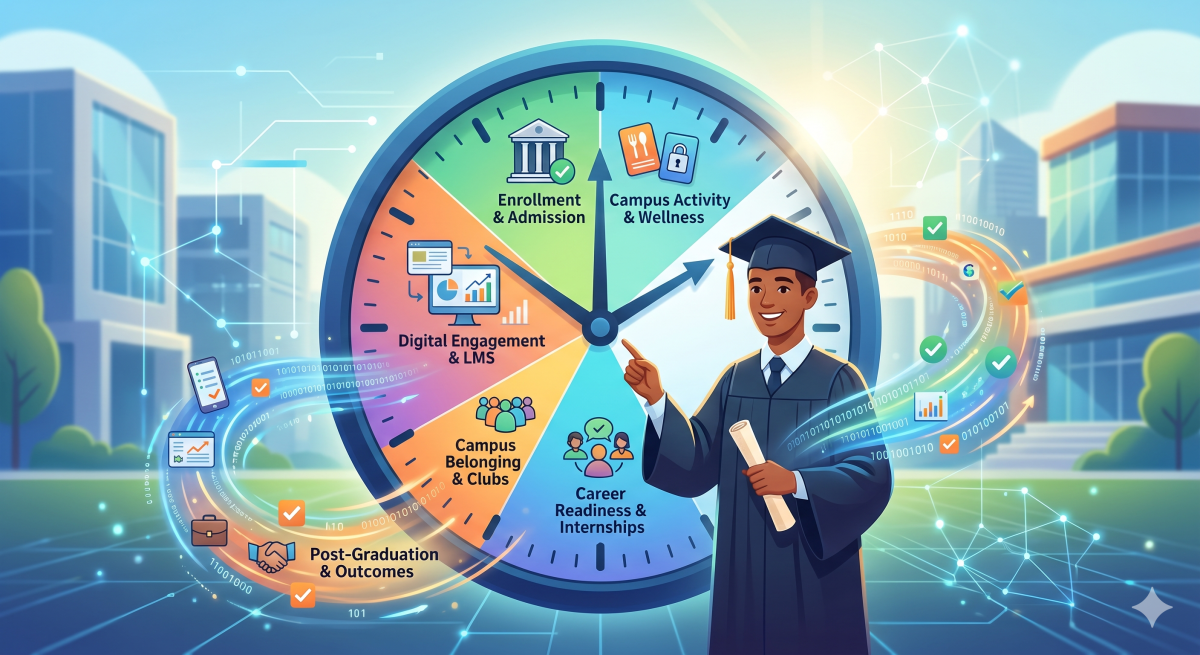
When these flow together, the institution gains a continuous, historical view of each learner — one that can be looked at day by day rather than as a single annual snapshot.
Why Integrated Student Records Matter for Higher Education
The case for unifying student data goes well beyond convenience. Fragmented data quietly undermines nearly every strategic priority an institution holds — from retention to enrollment to compliance.
Improving Retention and Student Success
The earliest signals that a student is struggling rarely show up in a single system. A dip in LMS engagement, a financial hold, and a missed advising appointment each look minor in isolation — but together they form a clear at-risk pattern. Integrated student records make those patterns visible early enough to act, allowing advisors and success teams to intervene before a student disengages entirely.
Powering Smarter Enrollment and Recruitment
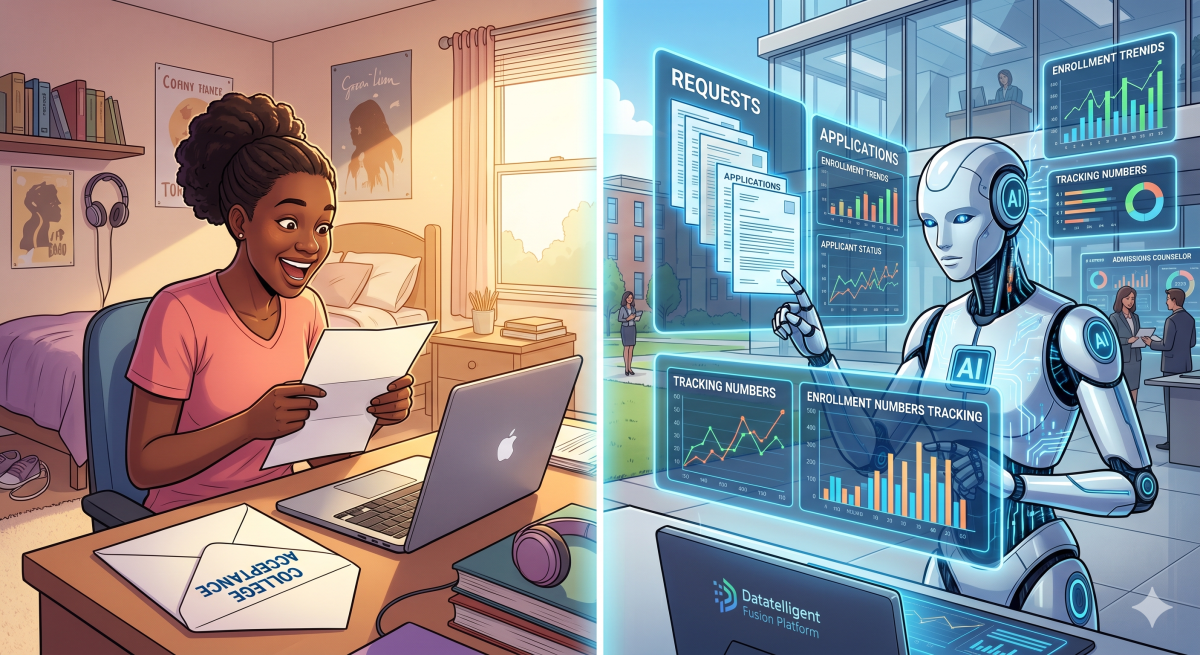
Enrollment teams need to understand not just who applied, but how today’s prospects compare to the students who succeeded in the past. Connecting recruitment data to outcomes data turns guesswork into strategy. Our work on AI-powered enrollment platforms for colleges shows how unified data feeds predictive models that sharpen recruiting and yield decisions.
Reducing Reporting Burden and Manual Work
When data lives in disconnected systems, every report — IPEDS, Title IV, accreditation, board updates — becomes a manual reconciliation project. Integrated student records establish a single source of truth, dramatically cutting the time staff spend pulling, cleaning, and matching data by hand. Many institutions find this alone justifies the investment.
Protecting Student Privacy and Maintaining FERPA Compliance
Unifying data does not mean exposing it. A well-designed integrated record is governed: access is role-based, sensitive fields are protected, and the system is built to support FERPA compliance rather than complicate it. Strong data harmonization and governance ensure the right people see the right data — and no one sees what they shouldn’t.
The Challenges of Building Integrated Student Records
If integration were easy, every institution would already have it. The obstacles are real, but each is solvable with the right approach.
Data Silos and Incompatible Systems
Campus systems are rarely designed to share data. The SIS, LMS, and CRM each store information in their own structure, with their own definitions and identifiers. Bridging them requires both technical pipelines and a shared understanding of what the data means.
Inconsistent Definitions and Data Quality
Does “enrolled” mean the same thing in the SIS as it does in the financial aid system? Often, no. Different departments define the same terms differently, and small inconsistencies compound into untrustworthy reports. Harmonizing definitions across the institution is as much a governance challenge as a technical one.
Limited Internal Resources
Many institutions simply don’t have a large data engineering team. Building and maintaining integration pipelines, a data lake, and a governed model in-house is a heavy lift. This is where a managed approach — handled by a dedicated data team — lets institutions get integrated records without hiring an entire department.
How to Build Integrated Student Records: A Practical Framework
Creating integrated student records is a sequence of well-understood steps. The path looks consistent across institutions, even as the details vary.
Step 1: Collect Data From Every Source
The foundation is reliable data movement. Automated flows pull data from the SIS, LMS, CRM, financial aid, and other systems into a central location, ensuring information arrives consistently and on schedule. Datatelligent’s Data Flows automate this ingestion so source data lands reliably without manual exports.
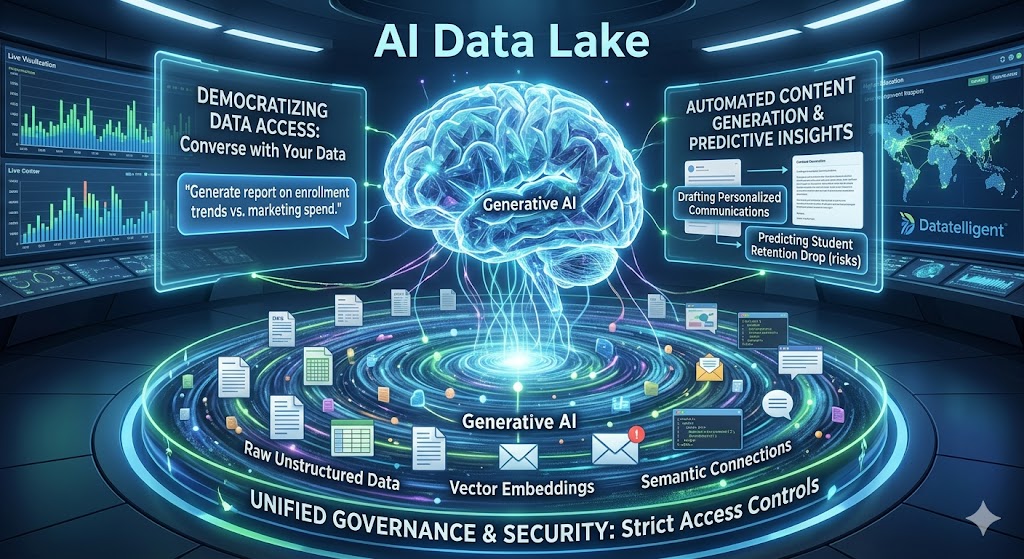
Step 2: Centralize in a Unified Data Lake
Once collected, data needs a home that can hold history and scale across sources. A unified data lake stores raw and processed data together, preserving the day-by-day history that makes trend analysis and longitudinal tracking possible.
Step 3: Harmonize and Govern the Data
Centralized data still isn’t integrated until it’s harmonized — aligned to consistent definitions, cleaned, deduplicated, and governed with appropriate access controls. This is the step that turns a pile of source data into a trustworthy, unified student record.
Step 4: Turn Records Into Insights
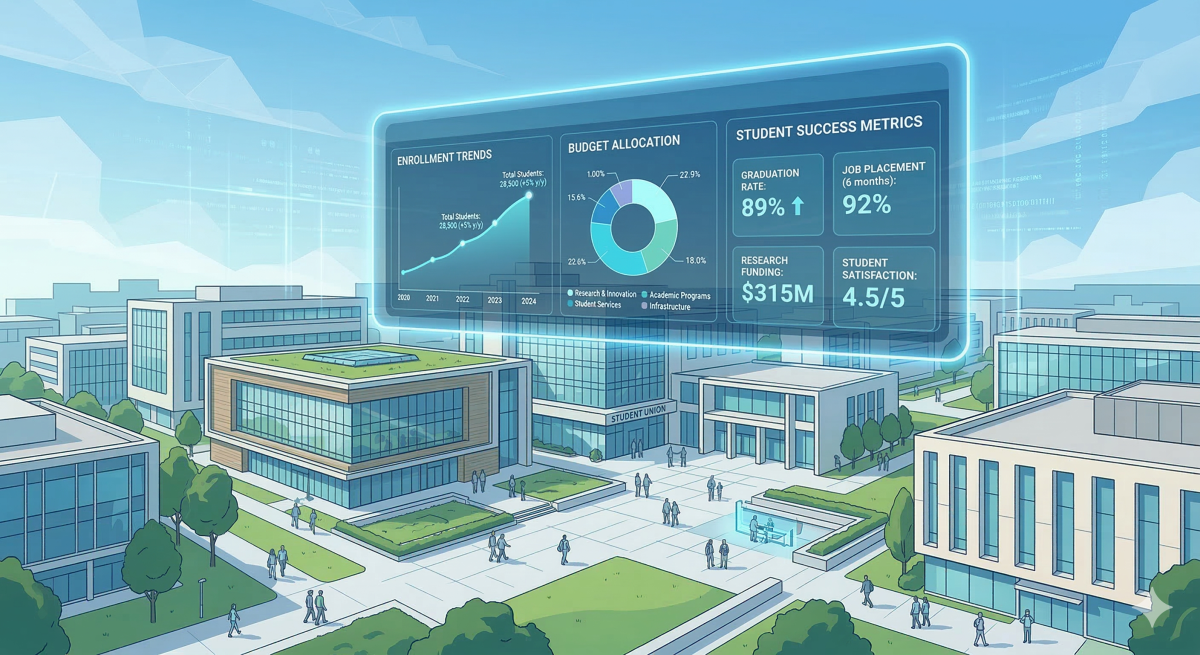
With clean, integrated records in place, institutions can layer on intelligent insights — dashboards, predictive models, and AI — to flag at-risk students, forecast enrollment, and measure outcomes across the entire student lifecycle.
From Fragmented Data to a Unified Student View
Integrated student records aren’t a single product you buy off a shelf — they’re the result of connecting collection, centralization, harmonization, and insight into one continuous system. Done well, they transform student data from a reporting headache into the institution’s most valuable strategic asset.
Datatelligent’s Fusion Platform for Higher Education was built for exactly this: collecting and harmonizing data from across your campus systems to deliver insights across the entire student lifecycle. If your institution is ready to move from scattered systems to a single, trusted view of every student, talk with our team about where to start.
Frequently Asked Questions About Integrated Student Records
What is the difference between integrated student records and a student information system?
A student information system manages core functions like enrollment, grades, and transcripts. Integrated student records combine SIS data with information from the LMS, CRM, financial aid, and other systems to create a single, complete view of each student that no individual SIS provides alone.
Do integrated student records replace our existing systems?
No. Integration sits across the systems you already own, drawing data from each rather than replacing them. Your SIS, LMS, and CRM stay in place; the integrated record connects them.
Are integrated student records FERPA compliant?
They can and should be. A properly designed integrated record uses role-based access and governance to protect sensitive data, supporting FERPA compliance rather than putting it at risk.
How long does it take to build integrated student records?
Timelines vary with the number of source systems and the state of your existing data, but a managed, phased approach lets institutions see value early — often starting with high-priority data sources and expanding from there.