Higher education institutions today are navigating an increasingly complex landscape, characterized by an abundance of data. From student lifecycle management in Customer Relationship Management (CRMs) and core business functions managed by Enterprise Resource Planning (ERP) systems, to academic records in Student Information Systems (SIS), course engagement in Learning Management Systems (LMS), and countless departmental Excel spreadsheets, the volume of data is immense. Yet, this wealth of information paradoxically often leads to insight poverty. The core issue is data fragmentation. Imagine trying to assemble a jigsaw puzzle where every piece comes from a different set; the picture never comes together, and the overall narrative remains elusive. This is the reality in many academic institutions where data resides in isolated silos.
This fragmentation is not merely an IT inconvenience; it is a significant impediment to agile strategic decision-making, operational efficiency, and the ability to deliver truly personalized and supportive student experiences. The challenge is not a lack of data, but a critical absence of connected, harmonized information. Addressing this requires more than just technological fixes; it often involves navigating deep-seated organizational structures and historical system adoption patterns that reinforce these silos. Departments may have procured systems to meet immediate, specific needs without a comprehensive institutional data strategy, leading to a patchwork where data sharing becomes an afterthought. The prevalence of informal data systems, like departmental spreadsheets, further highlights that relying solely on formal enterprise systems would yield an incomplete picture of institutional reality. These “shadow IT” systems often contain mission-critical information not captured by broader enterprise solutions. Therefore, unified data management solutions emerge as a strategic imperative, designed to dismantle these barriers, integrate these varied sources, and unlock the collective intelligence embedded within an institution’s data.
Defining the Digital Backbone: What Are Unified Data Tech Solutions?
At their core, unified data tech solutions, often architected as Unified Data Platforms (UDPs), function as the central nervous system for an institution’s data. These platforms are not just repositories; they are comprehensive solutions designed to enable both operational and analytical applications. They achieve this by systematically ingesting, integrating, storing, managing, processing, and analyzing data from a multitude of diverse and disparate sources. The primary goal is to create a centralized hub that offers a cohesive and consistent environment, effectively breaking down the data silos that plague many organizations. This drive towards unification aims to establish a “single source of truth,” ensuring that all analyses, reports, and decisions are founded upon a complete, accurate, and consistent dataset, encompassing structured and unstructured data, databases, applications, and even external data sets.
The architecture of such a platform typically includes several key components working in concert :
- Data Integration Tools: These are fundamental for collecting and combining data. Using processes like Extract, Transform, Load (ETL) or Extract, Load, Transform (ELT), they bring together information from varied systems such as CRMs, ERPs, SIS, LMS, and, importantly, even departmental Excel documents, ensuring a unified view.
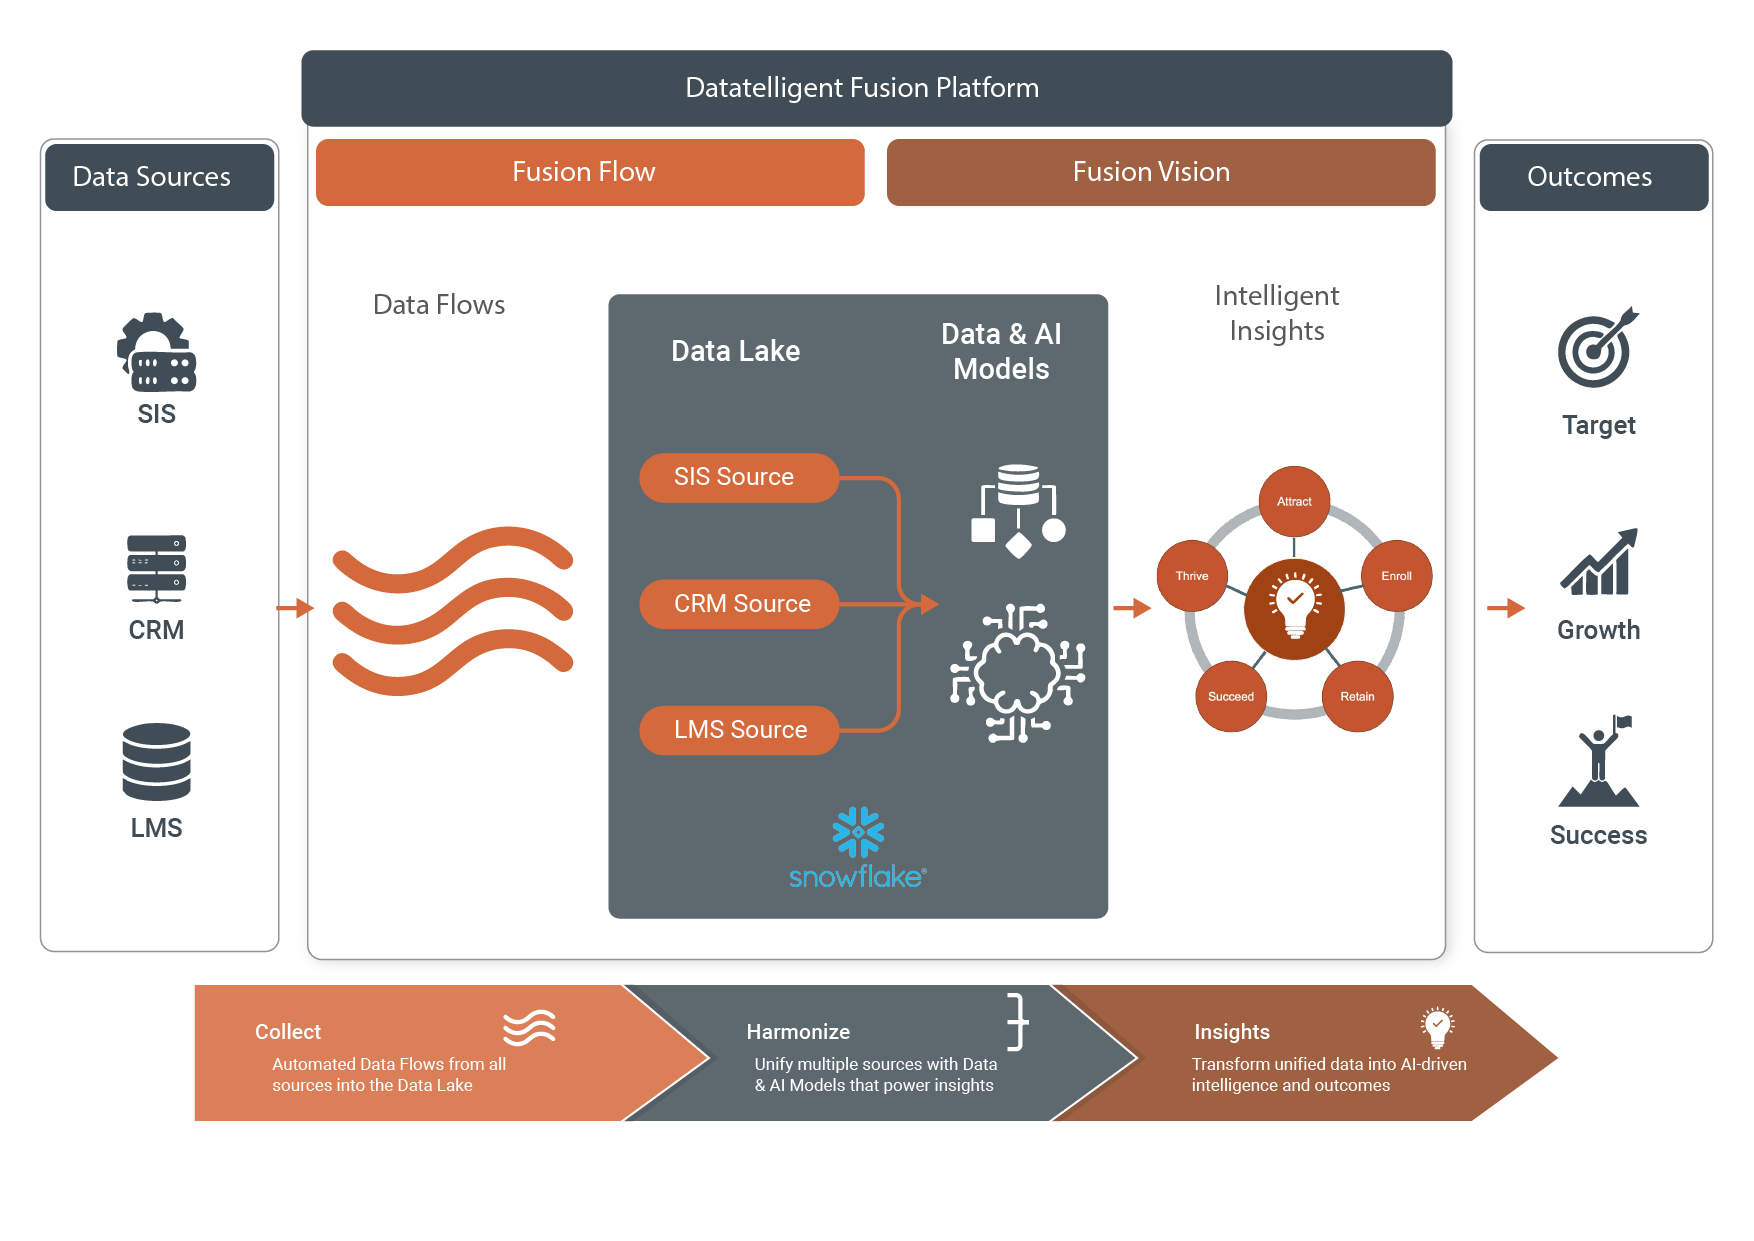
- Centralized Storage Infrastructure: This usually takes the form of a modern data warehouse or data lake, engineered for scalability and the capacity to handle diverse data types. Datatelligent, for instance, builds its solutions on platforms like Snowflake, known for such capabilities.
- Data Governance and Security Mechanisms: These are critical for maintaining data quality, ensuring consistency, and adhering to stringent regulatory requirements, such as FERPA in the higher education context. Robust data protection is achieved through measures like encryption and granular access controls.
- Processing and Analytics Capabilities: These are the engines that drive insight generation. They support essential data operations like cleansing and aggregation, as well as advanced statistical analysis and machine learning technique.
- Data Visualization and Reporting Functionalities: Tools such as Microsoft Power BI or Tableau, with which Datatelligent partners , allow users to create interactive dashboards, reports, and visual representations of data, making complex information accessible and understandable.
The implementation of such unified data tech solutions yields substantial benefits. Organizations experience improved data accessibility and availability, empowering users across departments to locate and utilize information, thereby fostering collaboration. Data quality and consistency are significantly enhanced as the consolidation process helps identify and rectify errors and redundancies; this is particularly crucial when considering that up to 25% of institutional data may be inaccurate or incomplete (data accuracy study by Deloitte) . Consequently, institutions can accelerate data insights and make more timely, data-driven decisions. This also translates into increased operational efficiency and potential cost savings by streamlining data management processes and eliminating redundant efforts. Furthermore, these platforms often empower self-service analytics, providing tools that enable both technical and non-technical staff to explore data and generate their own insights, which is pivotal in cultivating a pervasive data-informed culture.
Beyond these immediate advantages, the adoption of a unified data solution with a “flexible and open architecture” represents a strategic investment in an institution’s agility and its ability to future-proof its operations. Higher education is a dynamic sector, constantly adapting to new pedagogical models, evolving student demographics, and changing regulatory landscapes. A rigid, outdated data infrastructure can severely hamper an institution’s ability to respond effectively. In contrast, an open and scalable unified platform allows for the easier integration of new data sources—perhaps from a new student wellness application or collaborative research platforms—and the adoption of emerging analytical tools.This adaptability, rooted in a flexible data foundation, provides a significant long-term strategic advantage, helping to avoid vendor lock-in and ensuring that the institution’s data capabilities can evolve with its needs.
While these platforms can “democratize data” by broadening access , effective data governance is the crucial counterweight that ensures this democratization leads to valuable, trustworthy insights rather than confusion or misuse. Expanding data access without robust governance—which includes clear data definitions, quality standards, access controls, and privacy protocols—can lead to misinterpretations, inconsistent analyses, privacy breaches, or decisions based on poorly understood information. Strong governance, therefore, is not a bureaucratic impediment but an essential enabler of reliable self-service analytics and a truly data-informed institutional culture.
Transforming Campuses: A Unified Servicing and Data Solution for Higher Education’s Unique Needs
Higher education institutions operate within a uniquely complex and interconnected data ecosystem, demanding a specialized approach to data unification. Beyond the standard enterprise systems like CRMs and ERPs, these institutions rely heavily on a diverse array of specialized platforms. These include Student Information Systems (SIS) for managing academic records and enrollment, Learning Management Systems (LMS) for course delivery and tracking student engagement, dedicated financial aid systems, library systems, grant management tools, alumni databases, and, critically, a multitude of departmental spreadsheets and local databases that capture nuanced operational data.
Each of these systems holds a vital piece of the puzzle related to the student lifecycle or an aspect of institutional operations. For instance, CRMs track the journey of prospective students and manage ongoing communications; the SIS contains essential demographic data and logs academic progress; the LMS monitors daily learning engagement; and ERPs manage the institution’s finances, human resources, and physical assets. The fundamental challenge, as highlighted by a 2023 EDUCAUSE report indicating that 72% of institutions struggle with data fragmentation, is that these vital pieces of information often remain disconnected. A unified servicing and data solution is specifically designed to bridge these informational gaps. Its purpose is to create the comprehensive, 360-degree view of students and operations necessary for holistic student support and institution-wide strategic planning. Such a solution moves beyond simple data aggregation; it implies an active use of insights to enhance the services provided to students, faculty, and staff, fostering a cycle of continuous improvement. For example, if unified data analysis reveals a common stumbling block in the online registration process for a particular student demographic (drawing from SIS, LMS, and web analytics), this insight would be fed back to the relevant departments to redesign the interface or offer targeted support, thereby directly improving the service based on data. The data solution thus becomes an active agent in service enhancement which Mixpanel also speaks about here.
Elevating the Student Journey with Integrated Data Insights
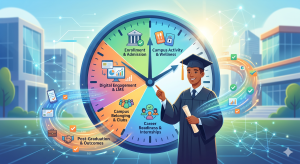
The impact of a unified servicing and data solution is profoundly felt across the entire student lifecycle:
- Personalized Student Support, Engagement, and Retention: By unifying data from the SIS (capturing grades and attendance), LMS (detailing online activity and assignment submissions), CRM (logging communication history and service requests), and even incorporating advising notes or flags from early alert systems, institutions can construct a dynamic and comprehensive profile for each student. This rich, integrated dataset fuels predictive analytics, enabling the proactive identification of students who may be at risk of academic difficulty or disengagement. This foresight allows for timely and targeted interventions, such as personalized academic support, referrals to counseling services, or proactive financial aid advice, directly contributing to improved student engagement, persistence, and ultimately, higher graduation rates. The goal is to genuinely “enrich the student experience” by delivering “personalized student learning experiences”.
- Optimized Student Recruitment and Enrollment Management: Integrating data from CRMs, application systems, website analytics, high school transcripts, standardized test scores, and even external third-party data sources like IPEDS (a practice Datatelligent incorporates) allows for sophisticated analysis of recruitment funnels and enrollment patterns. Institutions can thereby refine their marketing campaigns, personalize outreach to prospective students with tailored messaging, predict enrollment yields with greater accuracy, and strategically shape incoming classes to meet diversity, program-specific, and institutional goals.
- Enhanced Alumni Relations and Lifelong Engagement: Creating a centralized repository that consolidates alumni contact information, communication histories, event attendance records, volunteer activities, and donation records provides a powerful tool for alumni offices. This unified view enables more targeted, relevant, and meaningful engagement with alumni, fostering a stronger sense of community, increasing participation in alumni programs, and potentially boosting philanthropic support for the institution.
Streamlining Operations: Efficiency Gains from Unified Data
Beyond student-facing improvements, a unified servicing and data solution drives significant operational efficiencies:
- Improved Administrative Processes and Strategic Resource Allocation: The integration of financial data from ERP systems with enrollment data from the SIS, course demand information from the LMS, facilities usage records, and even departmental budgets maintained in Excel spreadsheets provides a transparent and comprehensive view of resource consumption and allocation across the institution. This holistic perspective supports more efficient budget planning, optimized staffing models, better utilization of physical spaces, and the identification of potential cost-saving opportunities, allowing institutions to “optimize resource allocation and improve academic programs” effectively.
- Simplified Regulatory Compliance and Institutional Reporting: A unified data platform, underpinned by robust data governance, significantly eases the burden of collecting, validating, and reporting data for mandatory external requirements (such as IPEDS, state and federal agencies, and accrediting bodies) as well as for internal performance monitoring. This drastically reduces the manual effort and time that Institutional Research (IR) departments typically spend on data wrangling, freeing up valuable analytical resources for more strategic initiatives. Furthermore, it enhances data accuracy and transparency, facilitating compliance with critical regulations like FERPA.
- Informed Strategic Planning and Institutional Advancement: Providing institutional leadership with timely access to comprehensive, reliable data across all critical domains—from student success metrics and research output to financial health and operational efficiency—is paramount. A unified data solution empowers more confident, evidence-based strategic decision-making regarding the development of new academic programs, investments in infrastructure, the planning of fundraising campaigns, and the formulation of long-term institutional priorities.
The true transformative power of unifying these diverse data sources—CRMs, ERPs, SIS, LMS, and even Excel documents—lies in its ability to shift an institution’s operational posture from being primarily reactive to past events to becoming proactive and even predictive in its management and student support. For example, without unified data, an institution might only become aware that a student is struggling when they fail an exam or formally withdraw—a reactive stance. With unified data, subtle patterns from LMS engagement, declining attendance noted in the SIS, and perhaps even changes in library usage or meal plan activity can be combined to predict risk before a critical failure point is reached, enabling proactive outreach and support.
Moreover, the conscious decision to incorporate departmental Excel spreadsheets and other informal data stores into a unified servicing and data solution not only enriches the central data repository but also validates the detailed work occurring within departments. This integration can uncover localized innovations or highly specific tracking methods that enterprise systems might not cover. By bringing these sources into the unified platform (under proper governance), institutions gain visibility into granular, department-level operations, identify potential best practices, and provide departmental staff with better analytical tools to work with their own data within the unified environment. This, in turn, can increase their engagement with and trust in the central system, helping to address resistance to change and bridge data literacy gaps.
The Future is Insight-Driven: Analytics Solutions Unified Method for Data Mining Predictive Analytics
A robust unified data foundation is the essential launchpad for unlocking the transformative potential of advanced analytics, including sophisticated data mining techniques and predictive modeling. While traditional reporting offers a valuable rearview mirror perspective on past events, an analytics solutions unified method for data mining predictive analytics empowers institutions to look forward—to discover hidden patterns within their data, understand complex interrelationships, and forecast future outcomes with a greater degree of confidence. Data mining involves systematically sifting through large, unified datasets to identify previously unknown trends, correlations, and anomalies. Predictive analytics then leverages this rich historical and current data, often employing statistical algorithms and machine learning techniques, to make informed predictions about future events or behaviors.
Harnessing these advanced capabilities can revolutionize how higher education institutions operate and serve their communities:
- Proactive Student Success Initiatives: As touched upon earlier, the combination of data from SIS, LMS, CRM, financial aid systems, and student engagement platforms can fuel powerful predictive models. These models can identify students at risk of academic difficulty, disengagement, or attrition much earlier than traditional methods allow, often before critical issues fully manifest. This foresight enables highly targeted, preemptive interventions, the development of personalized support strategies, and the strategic allocation of resources to maximize student success and retention. Datatelligent, for example, explicitly leverages “predictive analytics to identify at-risk students and improve retention”. *Note: this is a benefit of a matured data implementation.
- Strategic Enrollment Management and Forecasting: By analyzing historical application data, demographic trends, the effectiveness of past recruitment campaigns, and relevant external factors, institutions can build predictive models to forecast enrollment yields, optimize financial aid strategies to attract and support desired student populations, and anticipate demand for specific academic programs. This leads to more effective and efficient recruitment marketing, better alignment of institutional resources with student demand, and ultimately, improved institutional financial stability.
- Optimization of Academic Programs and Resource Planning: Predictive models can be employed to forecast student demand for particular courses, identify potential bottlenecks in academic pathways that might hinder student progression, and optimize the scheduling of classes and the allocation of faculty resources. This ensures that students can progress efficiently towards their degrees, improves faculty workload management, and enhances the overall efficiency of academic delivery.
- Personalized Learning Pathways and AI-Driven Support: Artificial intelligence (AI) and machine learning algorithms, when powered by comprehensive and unified student data, can facilitate the deployment of adaptive learning technologies. These systems can suggest personalized content within LMS platforms tailored to individual student needs and learning paces, and power AI-driven tutoring or advising support systems that can offer immediate assistance. Such AI applications can cater to individual student learning preferences, potentially improving learning outcomes and student satisfaction, while also automating responses to common queries, thereby freeing up human advisors to focus on more complex student issues. Work with Datatelligent to create a custom ML solution for your college.
The successful implementation and, more importantly, the effective utilization of an analytics solutions unified method for data mining predictive analytics represents more than just a technological leap. It signifies a profound cultural evolution within an institution—a decisive move from a primary reliance on historical precedent and anecdotal evidence towards an enthusiastic embrace of data-driven foresight and proactive, evidence-based strategy. This is not merely about possessing sophisticated analytical tools; it’s about fostering an environment where leadership and staff across all levels trust the insights generated by these models (even when they challenge conventional wisdom) and are empowered and encouraged to act upon them. This necessitates ongoing training, transparent communication about the capabilities and limitations of predictive models, and the active sharing of success stories to build confidence and drive widespread adoption.
However, as unified data fuels increasingly powerful predictive models and AI applications in higher education, the ethical considerations surrounding their use become critically important. Governance frameworks must evolve beyond ensuring data accuracy and privacy to rigorously address algorithmic fairness, bias detection and mitigation, and complete transparency in how these advanced analytics influence decisions impacting students and staff. When institutions unify extensive student data—spanning academic performance, demographic details, behavioral patterns, and financial information—to train predictive models for high-stakes decisions like admissions, at-risk identification, or scholarship allocation, there is a significant risk of perpetuating or even amplifying existing societal biases that may be present in the historical data. A responsible unified analytics strategy must therefore incorporate robust ethical oversight, regular audits of algorithms for fairness, clear mechanisms for redress, and transparent communication about how and why predictive models are being used.
The journey from basic data unification to sophisticated predictive analytics and AI adoption is not an overnight transformation but rather an evolutionary path reflecting an institution’s increasing data maturity. The progression typically starts with consolidating core systems to achieve a single source of truth. As data quality improves and user skills develop, institutions can then advance to more complex descriptive and diagnostic analytics. Subsequently, they can venture into predictive modeling and eventually leverage AI for deeper automation and insight generation. This “analytics solutions unified method” is thus a continuous improvement cycle, where capabilities are built incrementally, and insights from one stage inform and enable the next.
Datatelligent: Your Partner in Forging a Data-Driven Future
The power to transform your institution and enhance student outcomes lies within your data. Navigating the path from fragmented information to actionable, predictive insights requires not just technology, but also deep expertise and a clear strategic approach. Discover how Datatelligent’s unified data solution can help you unlock this potential, empowering your institution to drive student success and achieve new levels of operational excellence. Datatelligent is committed to the higher education sector, partnering with leading platforms like Snowflake and guiding institutions as they advance on their data maturity journey through unified data, predictive analytics, and AI.