Try Our FREE IPEDS Comparison Tool!

Categories
Blog Uncategorized

Beyond the Chatbot Hype: Implementing Effective AI for Higher Education Strategic Planning 

Artificial Intelligence is currently the loudest topic in higher education boardrooms and IT departments. The promise is immense: predictive modeling for student retention, personalized learning pathways, and streamlined administrative operations. 

However, the rush to adopt “AI for higher education” is leading many institutions into a common trap. They are prioritizing the flashy interface—the AI chatbot—over the foundational data infrastructure required to make that tool actually intelligent. 

This post explores why the current common approach to institutional AI often fails to deliver ROI and how Datatelligent takes a data-first approach, ensuring that when you do apply AI, it provides deep, actionable value rather than surface-level answers. 

The Current Landscape: The Flawed “Magic Box” Approach 

Right now, the most common AI technique being piloted by colleges and universities is the generative AI chatbot designed for “general level access” to institutional knowledge. 

The typical scenario looks like this: An institution wants an internal tool where administrators can ask questions like, “How does our current engineering enrollment impact our 5-year housing revenue projection?” 

To achieve this, IT teams hastily assemble a vector database filled with dozens of PDFs—strategic plans, recent enrollment reports, and disparate spreadsheets—and sit a Large Language Model (LLM) on top of it. 

Why General Access Chatbots Fail in Siloed Environments 

The problem isn’t the AI model; it’s the data diet it’s being fed. 

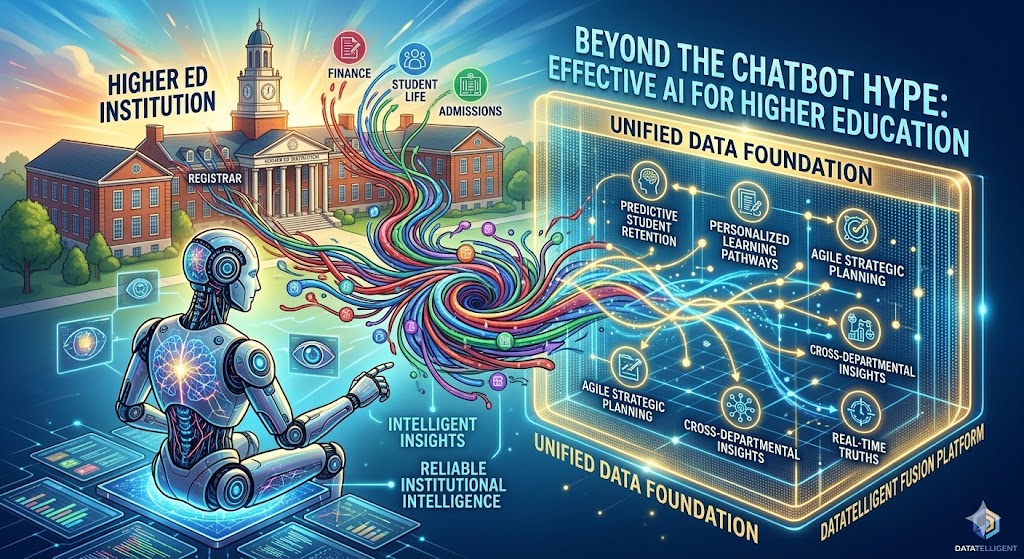
Most higher education institutions still suffer from deeply entrenched data silos. The Registrar’s data doesn’t speak fluently to Finance’s data, which is completely disconnected from Student Life data. 

When you implement a “general access” chatbot over fragmented data, you don’t get a unified intelligence; you get a confident hallucination. The chatbot might view specific parts of the data perfectly well, but it lacks the connective tissue to understand the relationships between those parts. It cannot accurately answer complex, cross-departmental questions because it is blind to the complete picture. 

The result is a shiny new tool that users quickly distrust because its answers are incomplete, lacks context, or are flat-out wrong. 

The Datatelligent Difference: A Foundation-First Strategy 

At DataTelligent, we believe that AI is only as good as the data infrastructure it sits upon. You cannot solve a data integration problem with an AI application. 

While the end result of working with Datatelligent’s Fusion Platform may well include advanced dashboards or chatbot capabilities, we don’t start there. We start by solving the root problem that plagues higher ed analytics: data unification. 

Creating Intelligent Insights Within the Data Lake 

Our approach begins with the Datatelligent Fusion Platform. Instead of letting an AI loosely browse disconnected folders, we proactively combine your various data sources—SIS, LMS, Finance, HR—into our pre-made, higher-ed-specific datasets. 

We do the heavy lifting of cleaning, normalizing, and relating the data before the AI ever touches it. We are essentially creating “intelligent insights” directly within the data lake itself by structuring the data in a way that already highlights relationships and trends. 

Because we organize the data based on proven models for higher education, it becomes significantly easier for any AI tool sitting on top to understand the context and pull out real value. By preparing the environment first, we ensure the AI is generating reliable institutional intelligence, not just summarizing PDFs. 

Agile Data for Strategic Planning: Going Deeper Than “General AI” 

Strategic planning in modern higher education requires agility—the ability to pivot quickly based on real-time truths. This requires more than just “General AI.” 

General AI, like off-the-shelf tools or poorly implemented internal bots, can give you generic advice on best practices. But they cannot tell you how your specific institution should react to a sudden shift in applicant demographics combined with a new state funding model. 

Ensuring the AI Has the Correct Data to Work With 

Agile data means having data that is ready for analysis the moment a question is asked. By using the DataTelligent Fusion Platform to pre-integrate your data sources, you empower AI tools to go deeper. 

Instead of asking general questions, you can use AI to stress-test specific strategic scenarios against your actual historical data across all departments. You can move from reactive reporting to proactive, predictive strategy because the AI has the correct, contextualized data required to perform complex reasoning. 

True strategic advantage doesn’t come from having a chatbot; it comes from having a unified data foundation that makes your AI tools genuinely intelligent. 

Check out our one-pager on our AI Workshop for more info on how Datatelligent makes AI better for higher education institutions.

Categories
Blog Uncategorized

Fusion Platform Series (Part 3): Unlocking Institutional Intelligence with Fusion Vision

Welcome to the finale of our Fusion Platform blog series.

In Part 1, we built the pipelines with Data Flows. In Part 2, we centralized and organized that information into the Data Lake using our preset higher education models.

Now, we arrive at the moment where all that infrastructure pays off. It’s time to turn raw data into strategic power.

Welcome to Fusion Vision.


Moving Beyond Static Reporting to Dynamic Higher Education Analytics

For many institutional research professionals, the job often feels like being a “report factory.” You spend weeks building a static report, and by the time it reaches leadership, the data is stale, or they have a follow-up question that requires another week of work.

Fusion Vision changes this dynamic. Because we have already standardized and modeled the data in the Data Lake (Step 2), we can now instantly layer powerful visualization tools on top of it.

This isn’t just about making pretty charts; it’s about speed and accessibility. Fusion Vision allows you to move your data effortlessly into interactive KPI dashboards that track enrollment, retention, and student success in real-time.


Democratizing Data: Insights for Everyone

The true goal of the Fusion Platform is to break down the walls around data. Historically, only a few people with SQL skills could access the “source of truth.”

With Fusion Vision, we democratize access. Whether it’s the Provost, the Dean of Student Affairs, or the Financial Aid office, stakeholders get secure access to the insights they need without having to submit a ticket to IT.

The Power of AI and Chatbots in Higher Ed

One of the most exciting additions to Fusion Vision is the integration of AI-driven Chatbots.

Imagine a Dean asking a plain-language question like, “What is the retention rate for first-generation students in the College of Arts & Sciences?” and getting an immediate, accurate answer visualized in a chart.

Because our preset models in the Data Lake have already defined the relationships between your data points, our AI tools can accurately interpret these questions. This empowers decision-makers to self-serve, freeing up the Institutional Research team to focus on complex, high-level strategic analysis rather than ad-hoc queries.


Survival of the Fittest: Why Colleges Need Intelligent Insights

In today’s competitive landscape, higher education institutions are under immense pressure. Enrollment cliffs, budget constraints, and retention challenges mean that colleges cannot afford to fly blind.

Fusion Vision delivers the intelligent analytics solutions required not just to operate, but to survive and thrive. By connecting the dots between disparate data sources—from the LMS to the ERP—you can spot at-risk students earlier, optimize financial aid distribution, and predict enrollment trends with greater accuracy.


The Complete Fusion Journey

We hope you’ve enjoyed this series on the Datatelligent Fusion Platform.

  1. Data Flows ensure your data moves securely and automatically.
  2. The Data Lake organizes and models it for higher education.
  3. Fusion Vision delivers the insights, dashboards, and AI tools that drive action.

Ready to see how Fusion Vision can transform your institution’s data culture? Explore our Analytic Solutions here.

Categories
Blog Uncategorized

Introducing Datatelligent’s Free IPEDS Enrollment Comparison Tool: Your Key to Unlocking Enrollment Insights 

We are thrilled to announce the launch of Datatelligent’s new IPEDS Enrollment Comparison Tool, now available to you free of charge! This powerful tool is designed to help institutions easily explore enrollment trends and benchmark performance using comprehensive IPEDS data. You can access the tool and start your analysis today at Datatelligent Enrollment Comparison Tool

How to Easily Use Your New Tool 

Getting started with the IPEDS Comparison Tool is simple and intuitive. For a visual guide, be sure to watch our detailed video tutorial: Datatelligent IPEDS Enrollment Comparison Tool Tutorial

Here are the quick steps to begin your comparison: 

  1. Select a School: In the top-left dropdown menu, click to expand the list. You can then use the search bar to quickly find your desired college by name. 
  1. Run Comparison: Once you select a school, the data comparison automatically runs, leveraging up-to-date IPEDS data. 
  1. Compare Multiple Institutions: The tool allows you to compare as many schools as you wish, providing instant insights into various enrollment metrics. You can view the percent change in enrollment over six years, graph enrollment headcount, and compare schools within the same sector, level, and region. The dashboard quickly shows six-year changes in student degree level, student intensity, and degree-seeking status. 

Benchmark Performance Against Your Peers 

Our comparison tool is exceptionally good for comparing your institution to peer schools. The chart automatically displays a trend line on your graph for similar colleges in your area, making it an excellent resource for benchmarking your performance against comparable institutions. This feature helps you quickly identify how your enrollment trends align with, or diverge from, those of your peers. 

Ensuring Your Data Future 

In an uncertain landscape where IPEDS data availability could be affected by government funding changes, Datatelligent provides a robust solution. We maintain a local copy of the IPEDS data, ensuring that you will continue to have access to this critical information even if the official IPEDS database becomes unavailable. We will be releasing a separate, in-depth article on this topic soon. 

Just a Taste of What We Offer 

While this free IPEDS Comparison Tool offers valuable insights, it’s only a glimpse of our full suite of capabilities. Datatelligent offers a comprehensive IPEDS Assistant, an advanced tooling solution that can automatically pull IPEDS data for you and perform a multitude of more complex comparisons tailored to your specific needs. To explore the full range of our offerings, visit our IPEDS Assistant Solutions Page. We encourage you to get in contact with us to learn more about how our advanced tools can empower your institution. 

Join Our Upcoming Webinar 

Have questions or want to see a live demonstration of the tool and our broader capabilities? We have a webinar coming up soon! Sign up here to secure your spot and gain further insights: Webinar Registration

Categories
Blog Uncategorized

Database Management System vs. Data Warehouse: Understanding the Core Differences for Better Data Management 

In today’s data-driven world, understanding how to store, manage, and analyze information is crucial for success. Two fundamental technologies often discussed are Database Management Systems (DBMS) or platforms, and Data Warehouses (DW). While both handle data, they serve distinct purposes and are optimized for different tasks. Confusing them can lead to inefficient processes and missed opportunities. At Datatelligent, we help organizations navigate these complexities. Let’s break down the key distinctions. 

What is a Database Management System (DBMS) / Platform? 

Think of a Database Management System as the engine that powers day-to-day operations. It’s software designed to create, read, update, and delete data in operational databases efficiently. 

Purpose: Running the Business (OLTP) 

A DBMS primarily supports Online Transaction Processing (OLTP). These are the frequent, short transactions essential for everyday business functions: 

  • Processing a customer order 
  • Updating inventory levels 
  • Registering a student for a course 
  • Recording a bank transaction 

The focus is on speed, accuracy, and consistency for current operations. 

Key Characteristics 

  • Real-time Data: Reflects the current state of the business. 
  • Normalized Structure: Data is typically organized to minimize redundancy and improve data integrity, often spread across many related tables. 
  • Optimized for Writes: Designed for frequent insertions, updates, and deletions. 
  • Focused Scope: Often supports a specific application or business process. 

What is a Data Warehouse (DW)? 

A Data Warehouse, on the other hand, is designed specifically for analysis and reporting. It consolidates data from various operational systems (often managed by DBMS) into a central repository optimized for querying and business intelligence. 

Purpose: Analyzing the Business (OLAP) 

Data Warehouses support Online Analytical Processing (OLAP). The goal is to analyze historical data to identify trends, patterns, and insights: 

  • Analyzing sales performance over the last five years 
  • Tracking marketing campaign effectiveness 
  • Understanding long-term student retention rates 
  • Generating quarterly financial reports 

The focus is on query performance and providing a comprehensive view for decision-making. 

Key Characteristics 

  • Historical Data: Stores large volumes of data accumulated over time. 
  • Optimized Structure for Reads: Often uses denormalized or specialized structures (like star or snowflake schemas) to speed up complex analytical queries. 
  • Optimized for Reads: Designed for efficiently querying large datasets. Updates are typically done in batches (e.g., nightly loads). 
  • Integrated Scope: Pulls data from multiple sources across the enterprise. 

The Key Difference Between Data Warehouse and Database Management System 

Feature Database Management System (DBMS) Data Warehouse (DW) 
Primary Goal Run daily operations (OLTP) Analyze business performance (OLAP) 
Data Focus Current, real-time data Historical, aggregated data 
Data Structure Normalized (reduces redundancy) Often Denormalized (optimizes queries) 
Processing Fast transactions (read, write, update) Complex analytical queries (read-heavy) 
Update Freq. Constant, real-time updates Periodic batch loads 
Scope Application-specific or departmental Enterprise-wide, integrated view 
Users Front-line workers, applications, DBAs Business analysts, data scientists, execs 

Data Management in Data Warehouse Environments 

Effective data management in data warehouse scenarios is crucial. It involves more than just storage; it’s about ensuring data quality, consistency, and accessibility for analysis. This typically involves robust ETL (Extract, Transform, Load) or ELT (Extract, Load, Transform) processes to pull data from source systems (often managed by DBMS), clean and reshape it, and load it into the management data warehouse structure. Governance, metadata management, and security are also key components of managing a DW effectively. The goal is to create a reliable “single source of truth” for analytical purposes. 

The Silo Effect: When Traditional Data Systems Create Barriers 

A significant challenge many organizations face, even those with data warehouses, is the persistence of data silos. This often happens when: 

  1. Departmental Solutions: Different departments implement their own databases or even separate data marts (smaller, focused data warehouses) without central coordination. 
  1. Software Limitations: Specific applications (like CRM, ERP, LMS) act as isolated database management platforms, storing valuable data that isn’t easily integrated elsewhere. 
  1. Legacy Systems: Older systems may be difficult to connect to modern warehousing solutions. 
  1. Lack of Strategy: Without a unified data strategy, data naturally fragments across various systems. 

These silos prevent a holistic view of the organization. Marketing data might be separate from sales data, which is separate from operational data, making comprehensive analysis difficult or impossible. As we discussed in our recent article, combining these fragmented sources into a unified platform, like a data lake, is often the next step to unlock the full potential of an organization’s data. 

Higher Education: A Case Study in Data Silos 

We see this challenge frequently in the Higher Education sector. Institutions rely on multiple specialized platforms, each acting as its own data management system: 

  • Learning Management Systems (LMS): Platforms like Canvas or Moodle store rich data about course engagement, assignment submissions, and student interactions within courses. 
  • Student Information Systems (SIS): Systems like Banner or PeopleSoft manage student records, registration, grades, financials, and demographic information. 
  • Admissions/CRM Systems: Tools used for recruitment and managing prospective student data. 
  • Financial Systems: Platforms managing budgets, grants, and institutional finances. 

Each platform is essential, but they often operate in isolation. Getting a simple report, like correlating student engagement in Canvas with their final grades and demographics stored in Banner, can become a major technical hurdle. This difference between data warehouse and database management system approaches becomes stark – the operational systems (LMS, SIS) hold the data, but analyzing it together requires a dedicated analytical layer, like a well-designed data warehouse or data lake, to break down the silos. 

Datatelligent: Your Partner in Unified Data 

Understanding the difference between data warehouse and database management system tools is the first step. The next is implementing the right strategy for your organization’s unique needs. 

Whether you’re struggling with data silos created by multiple database platforms, looking to build your first management data warehouse, optimize an existing one, or explore modern solutions like data lakes, Datatelligent can help. We meet you where you are in your data journey, providing the expertise and solutions needed to integrate your data, eliminate silos, and empower data-driven decision-making. 

Contact Datatelligent today to learn how we can help you unlock the true value of your data. 

Latest News
Days
Hours
Minutes