Marching Toward a Better Future
My Introduction to March of Dimes
In 2022 the U.S. preterm birthrate increased to 10.5% (slightly over one in 10), making the U.S. one of the most dangerous developed nations for childbirth. I knew the risk was there during my pregnancy, but I never expected to be part of that 10.5%…until I was admitted to the hospital with sudden, severe preeclampsia at 32 weeks. We accepted that our May baby was going to have a March birthday.
Before this, I had only heard of March of Dimes, but they suddenly had a massive impact on the outcome of my baby’s life and myself. First, the medical team administered an IV of magnesium sulfate to protect her brain and prevent seizures caused by my dangerously high blood pressure. Next, the team administered corticosteroid shots to help her lungs develop rapidly, preparing her for an early entrance. Both interventions were developed and funded through March of Dimes.
At 33 weeks and two days, Eisley made her grand entrance at 3lbs 6oz. She was tiny but healthy – her cry let us know the steroid shots had done their job! The next 28 days were a fever dream of NICU visits. Here, we found that March of Dimes funded resources, initiatives, and research that would guide us through the unknown. During a NICU visit, I saw a flyer for the 2022 March for Babies and felt inspired – but our experience was still too fresh. I promised myself that we would be a part of the event next year.
Rallying the Community
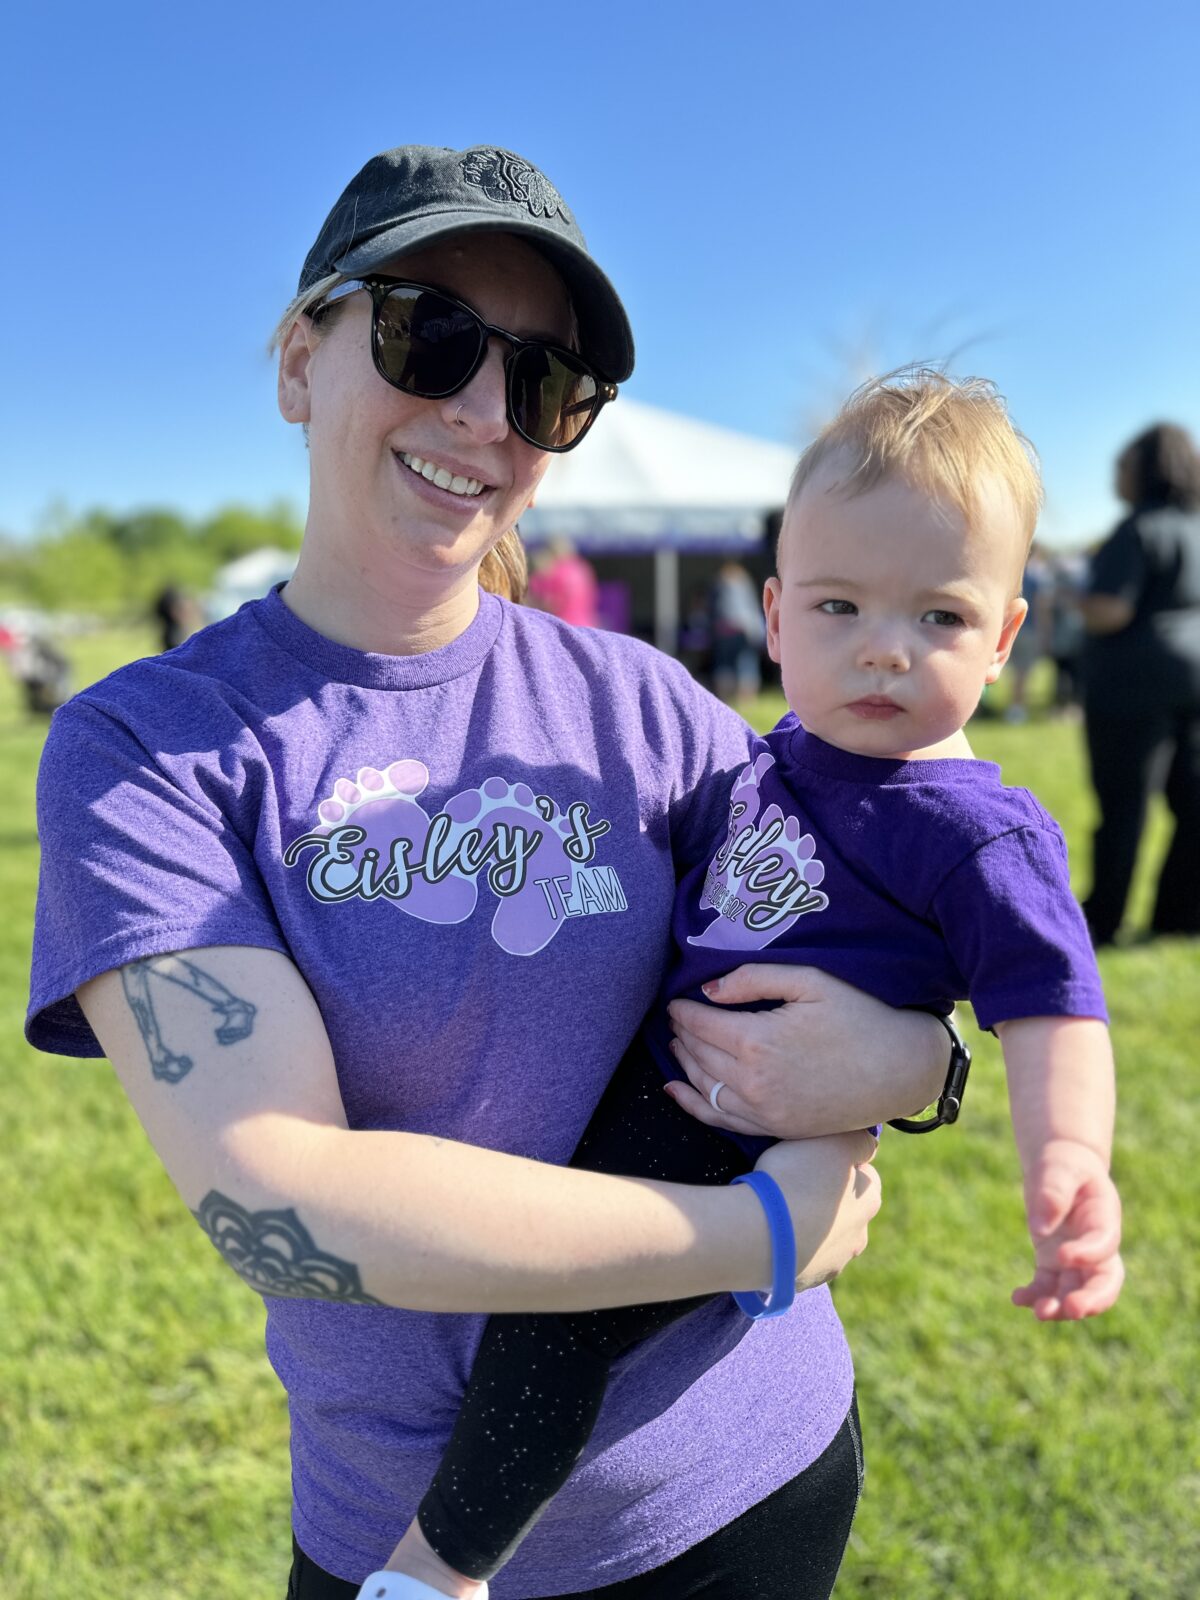
Fast forward to May 2023 – Eisley is a happy, healthy one-year-old, and Eisley’s Team has just finished our first March for Babies 5k. We weren’t alone, as I am incredibly fortunate to have a community in Datatelligent. When I decided we were ready to participate, my leadership and coworkers stepped up with an astounding show of support, encouragement, and donations. This action reaffirmed what I already knew about Datatelligent – we truly live our company purpose – to use data to make our communities better – as we tripled our original fundraising goal. Our CEO Larry and his family joined us on our walk. Eisley’s Team raised over $1,300 to help fund research and initiatives to create positive outcomes and equitable healthcare for mothers and babies!
What I Learned and What’s Next
Participating in our first March for Babies was a bittersweet experience. While it was inspiring and fun to come together and support those who will come after us, it was also disheartening to know there will be others. Until we end preventable maternal health risks, deaths, and preterm births, the need for advocacy and awareness remains. I hope that Eisley’s Team will grow even bigger in 2024 and that you’ll join us in supporting March of Dimes!