🎓 Join us Nov 4 for the Nov 4: DAAHE Q4 Meetup · How Dakota State put AI to work on graduation audits Register free →
Categories
Blog

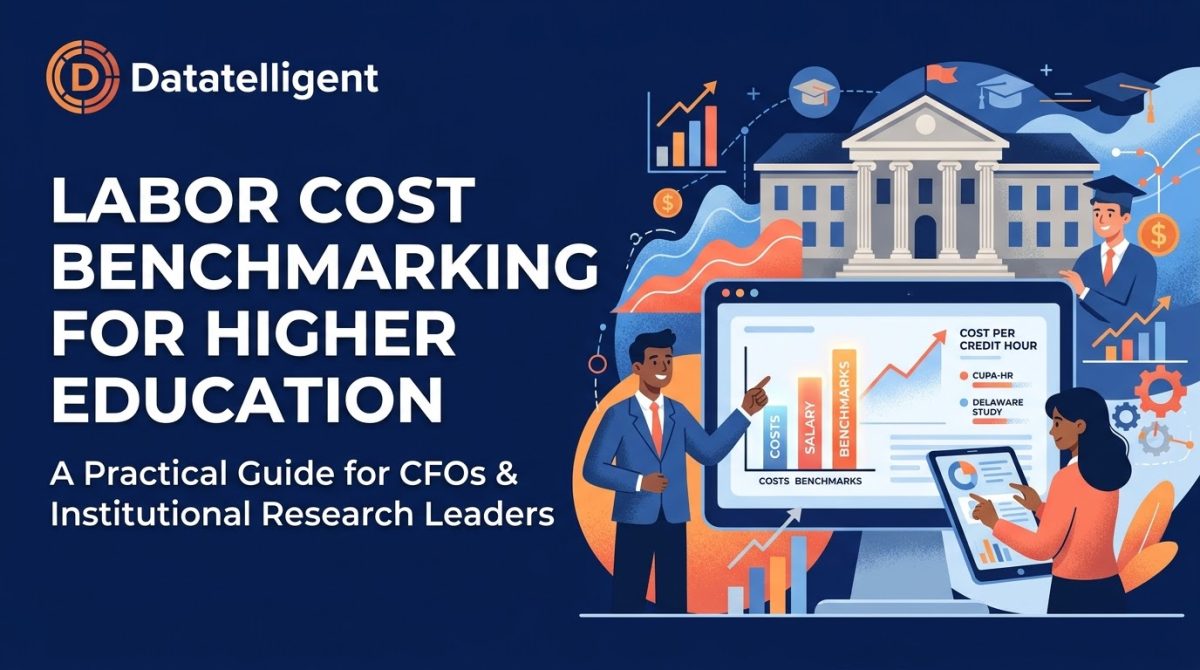
Labor Cost Benchmarking for Higher Education: A Practical Guide for CFOs and Institutional Research Leaders 

Labor is the single largest financial commitment on any college or university campus, consistently accounting for 65% to 75% of total operating expenditures. Yet when enrollment headwinds, tuition discounting pressures, or inflation tighten institutional margins, many leadership teams still rely on blunt instruments—hiring freezes, across-the-board departmental cuts, or deferred backfills—to balance the budget. 

Across-the-board cuts rarely solve structural deficits. Instead, they starve high-growth, high-margin academic programs while leaving underutilized instructional capacity and administrative bloat untouched. 

To protect academic quality while restoring fiscal health, Chief Financial Officers (CFOs) and Institutional Research (IR) leaders are turning to rigorous labor cost benchmarking. By connecting payroll and benefits actuals with instructional workload, student credit hours, and external peer datasets, institutions can move past gut-feel budgeting and make defensible, mission-aligned resource decisions. 

Why Labor Cost Benchmarking for Educational Institutions Is Different 

Applying standard corporate workforce metrics to a college or university almost always backfires. Effective labor cost benchmarking for educational institutions requires accounting for structural realities that do not exist in the private sector: 

Academic Tenure and Shared Governance: Instructional labor is not a variable cost that can be adjusted quarter by quarter. Multi-year contract obligations, tenure lines, and accreditation mandates for terminal-degree faculty create high fixed-cost floors. 

Complex Effort Splits: A single faculty member’s compensation may be split across classroom instruction, departmental administration (such as program chair duties or course releases), institutional service, and externally funded grant research. 

Divergent Contract Structures: Campuses manage a complex mix of 9-month and 12-month faculty appointments, per-course adjunct stipends, graduate assistantships, unionized staff, and auxiliary enterprise employees. 

The Finance vs. IR Data Divide: On most campuses, the Finance office views labor through the General Ledger (GL) and ERP—tracking budget-to-actuals, fringe benefit pools, and vacant position encumbrances. Meanwhile, Institutional Research views labor through census snapshots, IPEDS human resources classifications, and Student Information System (SIS) course sections. 

When Finance and IR operate in separate spreadsheets, leadership ends up debating whose numbers are right rather than deciding where to invest. Bridging those two perspectives is the foundation of strategic benchmarking. 

The Core Pillars of Higher Education Salary Benchmarking and Instructional Cost Analysis 

No single dataset tells the whole story of campus labor efficiency. High-performing finance and IR teams triangulate three primary external benchmarking sources alongside their internal operational data. 

Compensation and Staffing Ratios with CUPA-HR Salary Data 

When evaluating market competitiveness and compensation equity, CUPA-HR salary data (College and University Professional Association for Human Resources) is the gold standard for higher education salary benchmarking. 

CUPA-HR surveys allow institutions to benchmark salaries across administrator, professional, staff, and faculty roles—segmented by faculty rank (Professor, Associate, Assistant, Instructor) and 4-digit CIP (Classification of Instructional Programs) discipline codes. Rather than guessing whether a computer science or nursing faculty line requires a market premium, CFOs and HR leaders can compare institutional medians directly against custom peer groups by operating budget, enrollment size, and classification. 

Beyond base pay, mature benchmarking teams use CUPA-HR data to analyze: 

Position distribution ratios: Comparing administrative and professional staff FTEs per 1,000 students against peer medians to identify top-heavy overhead structures. 

Pay compression and equity: Identifying where long-tenured faculty or staff have fallen behind market rates relative to new hires. 

Instructional Productivity and the Delaware Cost Study 

While salary surveys explain what you pay per person, they do not measure instructional productivity. That is where the Delaware Cost Study (formally the National Study of Instructional Costs and Productivity) becomes indispensable. 

Operating at the academic discipline level (CIP code), the Delaware Cost Study enables institutions to benchmark: 

Direct instructional expense per student credit hour (SCH) taught: Comparing the actual labor and departmental operating cost of delivering a credit hour in Biology, Business, or English against national and Carnegie peers. 

Faculty teaching loads by category: Breaking down the proportion of undergraduate and graduate credit hours generated by tenured/tenure-track faculty, full-time non-tenure-track faculty, part-time/adjunct instructors, and teaching assistants. 

Class size and section efficiency: Revealing whether high instructional costs in a department are driven by above-market salaries or by small section sizes and under-enrolled upper-division courses. 

Federal Baselines via IPEDS Finance and Human Resources Surveys 

The Integrated Postsecondary Education Data System (IPEDS) provides a universal, publicly available baseline for macro-level labor cost benchmarking. By pulling IPEDS Finance and Human Resources survey data, IR teams can evaluate functional expense allocations: 

Instructional vs. Non-Instructional Spend: Benchmarking what percentage of total core expenses goes toward Instruction versus Academic Support, Student Services, and Institutional Support (central administration). 

Full-Time Equivalent (FTE) Staffing Trends: Tracking multi-year shifts in faculty-to-administrator ratios across peer cohorts. 

While IPEDS is essential for board-level context, its 12-to-24-month reporting lag and broad functional categories mean it must be paired with granular internal data and discipline-level benchmarks to drive operational decisions. 

Calculating True Cost Per Credit Hour and Program-Level Margin 

For CFOs and Provosts, the ultimate bridge between labor benchmarking and budget strategy is cost per credit hour. Knowing that your institution spends an average of $310 per credit hour campus-wide is rarely actionable; knowing that one program spends $185 per credit hour with a 92% course fill rate while another spends $640 per credit hour with a 48% fill rate changes how you allocate faculty lines. 

To calculate an accurate, decision-ready cost per credit hour, institutions must connect three layers of data: 

Direct Instructional Labor Cost: Base salary plus actual fringe benefits (healthcare, retirement contributions, tuition remission, payroll taxes) for every instructor of record, allocated proportionally to the credit hours of each course section taught. 

Unallocated Faculty Time and Release Cost: Accounting for reassigned time—such as department chair stipends, accreditation coordination, advising loads, or unfunded research releases—so those costs are transparently attributed to the department or program rather than hidden in a general pool. 

Indirect Academic and Institutional Overhead: Applying a consistent methodology to layer in dean’s office administration, academic advising, and student support costs when calculating full cost per degree awarded. 

Benchmarking Metric Core Formula Primary Data Sources Strategic Question Answered 
Direct Instructional Cost per Credit Hour $\frac{\text{Total Instructional Salary + Fringe}}{\text{Total Student Credit Hours (SCH) Generated}}$ HRIS/Payroll, GL, SIS, Delaware Cost Study How efficiently does each department deliver classroom instruction compared to discipline peers? 
Median Salary to Peer Market Ratio (Compa-Ratio) $\frac{\text{Institutional Median Salary by CIP/Role}}{\text{Peer Group Median Salary}}$ HRIS, CUPA-HR Salary Data Are we overpaying or risking turnover in high-demand academic and administrative roles? 
Instructional vs. Administrative Labor Ratio $\frac{\text{Instructional Compensation + Benefits}}{\text{Institutional Support Compensation + Benefits}}$ ERP/GL, IPEDS Finance & HR Is administrative overhead growing faster than our core academic investment? 
Net Program Contribution Margin per SCH $\text{Net Tuition Revenue per SCH} – \text{Direct Cost per Credit Hour}$ SIS, Financial Aid, GL/Payroll Which academic programs subsidize the institution, and which require structural redesign? 

A 4-Step Framework for Effective Labor Cost Benchmarking 

Building a sustainable benchmarking practice requires collaboration between Finance, Institutional Research, Human Resources, and Academic Affairs. 

1. Build a Defensible Peer Group 

Benchmarking fails immediately if Deans and Faculty Senate leaders reject the peer group. Move beyond “aspirational peers” and construct three distinct cohorts: 

Current Structural Peers: Institutions matching your Carnegie Classification, enrollment size, public/private control, unionization status, and regional cost of living. 

Program-Mix Peers: Campuses with a similar distribution of high-cost programs (e.g., allied health, engineering, fine arts) versus lower-cost lecture programs. 

Financial Viability Peers: Institutions achieving top-quartile student retention and operating margins within your sector. 

2. Reconcile ERP, HRIS, and SIS Data Definitions 

The biggest technical hurdle in labor cost benchmarking for educational institutions is entity resolution across campus systems. A faculty member’s payroll record lives in the ERP/HRIS, while their teaching load lives in the SIS. 

Before running benchmarks, Finance and IR must establish governed data definitions: 

How are cross-listed courses and team-taught sections credited? 

How are summer and intersession stipends treated relative to academic-year base pay? 

Are fringe benefits applied using an actual employee-by-employee calculation or a blended institutional fringe rate? 

3. Normalize for Discipline Mix and Delivery Modality 

Comparing the cost per credit hour of a clinical nursing cohort (which requires an 8:1 student-to-faculty ratio by state board mandate) to an introductory psychology lecture will always make nursing look expensive. Always normalize internal labor costs against discipline-specific benchmarks from the Delaware Cost Study and CUPA-HR salary data, and segment online, hybrid, and on-ground modalities separately. 

4. Pair Cost Benchmarks with Student Outcomes and Net Tuition Revenue 

Cost efficiency means nothing if it erodes student retention. A department that lowers its cost per credit hour by replacing full-time faculty with under-supported adjuncts in gateway courses may inadvertently trigger a 10% drop in first-to-second-year retention—costing the institution far more in lost net tuition revenue than it saved in payroll. Always evaluate labor cost metrics alongside DFW rates (D, F, and Withdrawal grades), course completion, and degree velocity. 

Using Financial Intelligence in Higher Education to Benchmark Labor Cost Continuously 

For decades, campus benchmarking was a static, backward-looking exercise. An IR analyst or finance director would spend six weeks pulling CSV exports from the ERP and SIS, manually VLOOKUP-ing IPEDS and CUPA-HR tables in Excel, and presenting a slide deck to the cabinet months after the fiscal year closed. By the time leadership saw the data, faculty contracts for the next academic year were already signed. 

Today, forward-thinking CFOs and IR leaders are deploying financial intelligence in higher education to benchmark labor cost dynamically throughout the budget cycle. Instead of treating benchmarking as a once-a-year compliance report, automated financial intelligence connects live operational data with external peer benchmarks so leaders can run proactive scenarios: 

Vacancy and Line-Reallocation Modeling: When a tenured faculty member retires, leadership can immediately view the department’s SCH trends, section fill rates, and Delaware Cost Study ratios to decide whether to refill the tenure line, convert it to an instructional track, or reallocate the line to a growing program with a waitlist. 

Adjunct vs. Overload Optimization: Tracking when departmental reliance on faculty overloads or part-time stipends crosses the financial threshold where hiring a full-time lecturer reduces cost per credit hour and improves student outcomes. 

Course Cap and Section Consolidation: Identifying low-enrollment course sections before registration closes, quantifying the exact instructional labor savings of consolidating three 12-student sections into two 18-student sections. 

How Datatelligent Helps Finance and IR Teams Turn Labor Data into Strategic Action 

Most CFOs and Institutional Research leaders don’t lack frameworks—they lack unified, trustworthy data. When your General Ledger, HR/Payroll system, Student Information System, and external datasets (IPEDS, CUPA-HR salary data, and the Delaware Cost Study) live in disconnected silos, your smartest analysts spend 80% of their time reconciling spreadsheets instead of advising leadership. 

Datatelligent was built specifically to eliminate that bottleneck for higher education. 

Through our Fusion Platform and Data Analytics as a Service (DAaaS) model, Datatelligent integrates your campus ERP, HRIS, SIS, and national benchmarking datasets into a single, governed data warehouse—complete with interactive dashboards designed for Provosts, CFOs, and IR directors. 

With Datatelligent, your institution can: 

Automate Cross-System Data Integration: Seamlessly connect payroll actuals, benefit loads, and position control with SIS course sections and credit hours—eliminating manual spreadsheet reconciliation between Finance and IR. 

Visualize Cost Per Credit Hour & Program ROI: Drill down from macro institutional expenses to college, department, CIP discipline, and individual course section margins in seconds. 

Benchmark Against Custom Peer Cohorts: Layer IPEDS, CUPA-HR, and instructional productivity benchmarks directly alongside your internal trends to spot compensation inequities, administrative bloat, and instructional bottlenecks early. 

Scale Without Adding Technical Headcount: Our Data Team as a Service (DTaaS) approach gives your campus dedicated higher-ed data engineers and analytics specialists who build, maintain, and govern your pipelines—accelerating your transition to a truly Data Informed institution at a fraction of the cost of hiring an internal team. 

Ready to move from reactive budget cuts to proactive financial intelligence in higher education to benchmark labor cost? Contact Datatelligent today to schedule a personalized demo and see how our higher education analytics solutions can bring clarity to your campus labor strategy. 
Categories
Blog

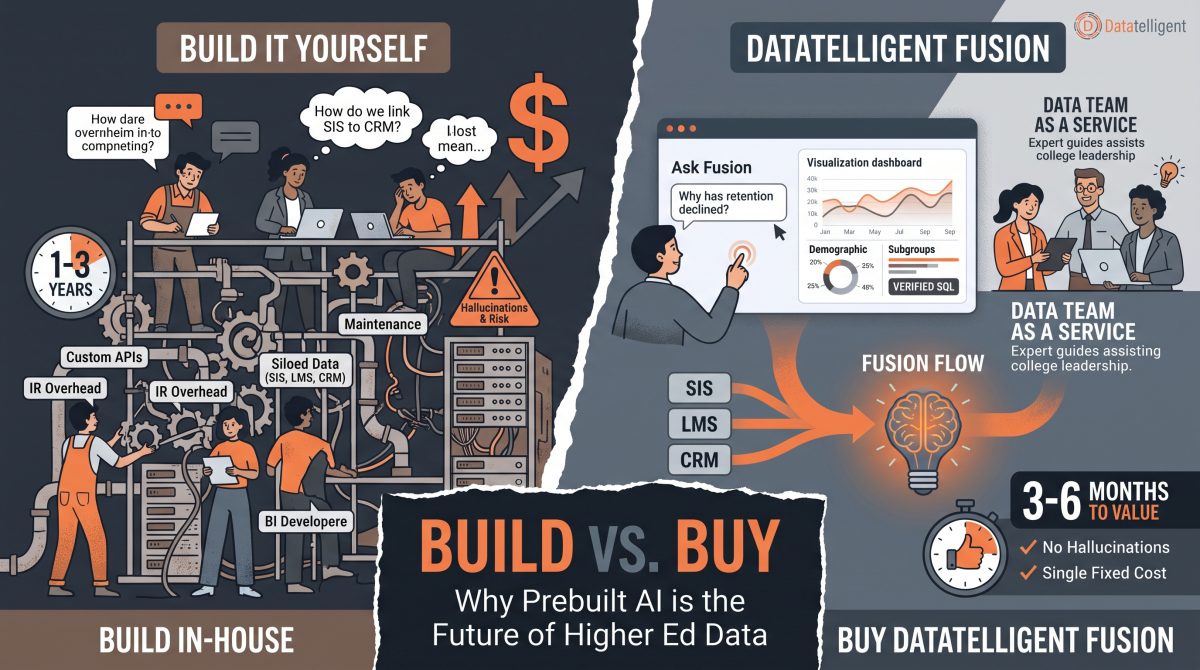
Build vs. Buy: Why Prebuilt AI is the Future of Higher Ed Data 

For higher education institutions, data is everywhere—siloed across your Student Information System (SIS), Learning Management System (LMS), CRM and other sources. Institutional Research (IR) departments are often overwhelmed by the sheer volume of ad-hoc reporting requests, spending weeks pulling data just to answer a single question from leadership. 

Connecting the entire student lifecycle—from Admissions to Success—requires a modern data architecture. But for most colleges, the question becomes: do we build an AI-driven data platform ourselves, or do we implement a prebuilt solution? 

Enter Datatelligent’s Fusion Intelligence. Fusion takes in all your institutional data sources, implements semantic layers to translate raw data into institutional knowledge, and delivers prebuilt analytics and KPI metrics right out of the box. 

Here is why higher ed leaders are choosing Fusion Intelligence  over costly internal builds. 

The Power of Conversational AI: Meet “Ask Fusion” 

Generative AI is powerful, but in higher education, you cannot afford “hallucinations”—made-up answers that sound confident but are factually incorrect. 

The Ask Fusion feature in Fusion Intelligence is built specifically to solve this. Because it sits on top of Fusion’s carefully constructed semantic layer, it allows users to ask natural language questions about their data and get actual, verified results. It even shows the underlying SQL query so your IR team can trust the math. 

Instead of waiting days for a report, campus stakeholders get instant AI-driven insights complete with bright spots, watch points, and actionable next steps. 

See it in action: 

  • 🎥 Watch: Fusion Enrollment Trends – See how leaders use Ask Fusion to ask, “Why has retention declined?” and instantly receive targeted analysis on specific demographic subgroups, right alongside live headcount and FTE dashboards. 
  • 🎥 Watch: Fusion Admission Funnel Demo – Watch how seamless it is to track candidate stages year-over-year and ask, “Where are we losing students in the funnel?” to immediately identify bottlenecks. 

The Real Cost: Building Internally vs. Datatelligent Fusion 

If a college decides to build a comprehensive data lake and AI conversational layer in-house, the financial and operational burden falls entirely on the IR and IT departments. 

To even get close to the functionality of Fusion Intelligence, an institution would need to hire an entirely new roster of highly paid specialists: 

  • Data Engineers to build and maintain pipelines from the SIS, LMS, CRM and other sources. 
  • Data Architects to construct the data lake and map the semantic layer. 
  • AI Specialists to integrate LLMs and build guardrails against hallucinations. 
  • BI Developers to design the dashboards and KPI tracking. 

The “Build vs. Buy” Breakdown 

 Building In-House Datatelligent Fusion Intelligence 
Team Required Multiple new hires (Data Engineer, AI Specialist, BI Developer, etc.) Handled entirely by our Implementation Team  
Time to Value 1-3 years of development and testing, solution by solution 3-6 months to first insight.  Prebuilt higher ed solutions for full student lifecycle 
Data Integration Custom API builds for every disparate system Fusion Flow (Pre-built connectors for higher ed systems) 
AI Reliability High risk of hallucinations without strict, costly guardrails Ask Fusion (Grounded strictly in your data, and limited to your semantic layer) 
Cost Multiple salaries + Multiple tools Single tool at a single fixed cost 

Ready to transform your campus data? 

Stop waiting for data insights and start making proactive decisions today. Start your journey with Fusion here. 

Categories
Blog

The New Mandate for Student Affairs: Moving from Reactive to Predictive

As a VP of Student Affairs, your success is increasingly measured by a single, high-stakes metric: student retention. In an era of shifting demographics and intensifying competition, the pressure to not only enroll but also graduate students has reached a fever pitch.

For years, student success initiatives have relied on the dedication of advisors and the intuition of faculty. However, these traditional methods are frequently proving insufficient. By the time a student’s struggle is visible to the naked eye, the window for effective intervention has often already closed. At Datatelligent, we believe the solution lies in a fundamental shift in perspective. To meet modern retention goals, institutions must transition from a reactive posture to a data-driven, predictive model of student support.

The Problem with the Status Quo

The current reality on many campuses is one of “lagging indicators.” Institutions typically wait for mid-term grades or faculty alerts to trigger outreach. While these are valuable touchpoints, they represent late-stage evidence of a problem that likely began weeks or months earlier.

Waiting for a student to fail a mid-term exam is a high-risk strategy. By that point, the student may have already disengaged from campus life, fallen hopelessly behind in their coursework, or decided that the financial burden is no longer worth the struggle. Early intervention is the cornerstone of retention, yet early intervention is impossible if you are only looking at outcomes that occur halfway through a semester.

Building an At-Risk Student Identification System

To intervene early, you need to see the “digital breadcrumbs” students leave behind long before a grade is ever posted. This requires breaking down the silos between departments and connecting disparate data sources.

A robust at-risk student identification system integrates data from the Learning Management System (LMS), Student Information System (SIS), and even non-academic sources like dining hall card swipes, housing logs, and gym attendance. When these data points are viewed holistically, they tell a story. A sudden drop in LMS logins combined with a decrease in card swipe activity at the student union isn’t just a coincidence; it is a behavioral pattern that signals a student is withdrawing from the campus community. By centralizing this data, institutions can identify vulnerable students based on engagement, not just performance.

Leveraging Predictive Analytics for Student Retention

Identifying “at-risk” students is only the first step. The next evolution involves moving beyond simple alerts to sophisticated modeling. This is where predictive analytics for student retention becomes a game-changer.

By employing machine learning models, institutions can analyze historical data to identify the subtle precursors to attrition. These models can weigh dozens of variables—from financial aid status and first-generation background to high school GPA and real-time behavioral data—to assign a “success score” to every student. This allows your team to prioritize outreach to those who are statistically most likely to drop out, even if they currently have a passing grade. Predictive modeling transforms your staff from a reactive “firefighting” crew into a proactive success team that can prevent the fire from starting in the first place.

Choosing the Right Student Retention Analytics Software

Not all platforms are created equal. When evaluating student retention analytics software, VPs of Student Affairs should prioritize three critical areas:

  • Seamless Integration: The software must be able to ingest data from your existing tech stack (Banner, Colleague, Canvas, etc.) without requiring a massive overhaul of your IT infrastructure.
  • Real-Time Insights: Data that is a week old is already stale. You need a platform that provides live dashboards, allowing advisors to act the moment a student’s behavior deviates from their baseline.
  • Usability for Frontline Staff: The most powerful data in the world is useless if it isn’t accessible. The software should provide intuitive, actionable insights that advisors can understand at a glance, enabling them to focus on the human element of student support rather than data interpretation.

Conclusion

The mandate for Student Affairs has changed. It is no longer enough to provide excellent services and hope students find them; we must use the data at our fingertips to find the students who need us most. By moving toward a proactive, predictive model, institutions can significantly improve student outcomes and institutional stability.

Learn how Datatelligent empowers VP of Student Affairs to transform their retention strategies by turning complex data into a clear roadmap for student success.

Categories
Blog

The Impact of Student Sense of Belonging on College Retention (And How to Measure It) 

A strong sense of belonging is having a major moment in higher education, and for good reason. While the feeling that you belong has always been crucial in personal relationships and work, researchers emphasize that defining and measuring it in educational settings remains elusive. 

Understanding how students find their place—especially leading up to and during their first college experience—is critical for boosting student retention and enrollment success. 

Why a Sense of Belonging Matters for Student Success 

Social connection is vitally important for mental health. In fact, Psychology Today (2025) reports that it is one of the “single strongest contributors to one’s happiness and well-being”. Isolation and depression—feelings counter to belonging—can begin as early as elementary school. Research shows that children with high levels of belonging see themselves as important and likable, which drives their willingness to participate. The confidence that belonging brings also builds social capital, influencing how others perceive them. 

However, research demonstrates that specific student subgroups are at a higher risk for non-enrollment and dropping out because they may not believe they belong. When historically under-served students, first-generation students, and students with intersectional identities (such as race, ethnicity, age, religion, socioeconomic status, or sexual orientation) face discomfort and isolation, the potential to impede their success is much higher—especially when compounded by financial stress. 

As Dias-Broens et al. note, “students’ sense of belonging was found to be positively related to emotional wellbeing, academic motivation and success in higher education”. 

The Challenge of Measuring Student Belonging 

If we understand its relationship to college persistence, why is measuring a student’s sense of belonging so difficult? Here are the primary hurdles: 

  • Unique Campus Factors: Sense of belonging cannot be studied in isolation. Like all social science research, it is influenced by a unique set of variables specific to each individual campus. 
  • Subjectivity in Self-Reported Data: Most analyses rely on self-reported data. While this yields important qualitative information, it depends heavily on students understanding the survey questions and accurately assessing their own feelings of acceptance. Administering emotional intelligence assessments in First-Year Experience (FYE) classes reveals that answering from the viewpoint of who you truly are versus who you want others to think you are is incredibly difficult for new college students. 
  • Declining Survey Response Rates: It is becoming harder to convince students to share their private thoughts, a phenomenon directly correlated to the engagement we are trying to measure. According to the National Survey of Student Engagement (NSSE), response rates have plummeted from 38% in 2010 to just 23% in 2024. Similar declines have been observed in institutional effectiveness offices, with the Ruffalo Noel Levitz Student Satisfaction Inventory (SSI) hitting a new low of under 30%. 

A Mixed-Methodology Approach to Measuring Campus Engagement 

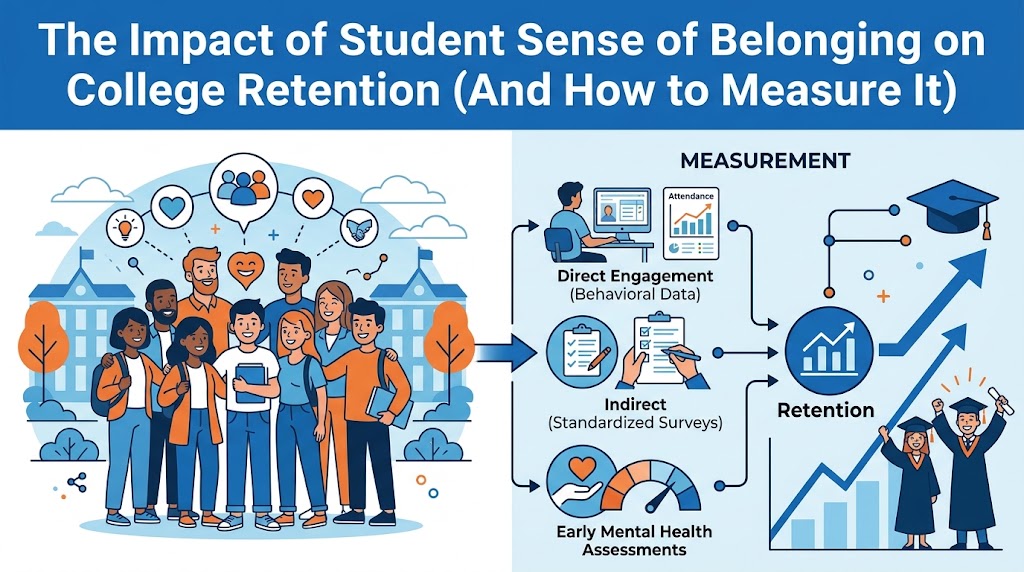
So, what can enrollment managers and higher education administrators do to measure this vital influence on persistence and retention? The most effective option is to use a mixed-methodology approach: 

1. Direct Measures of Engagement 

Track behavioral data to see how students are interacting with the campus ecosystem. Key metrics include: 

  • Attendance in physical and virtual classroom environments. 
  • Academic participation (e.g., LMS discussion boards and classroom discussions). 
  • Facility usage, including tutoring centers, libraries, and dining halls. 
  • Time to first enrollment and re-enrollment rates. 
  • Event engagement, such as athletics, fine arts, and student clubs or organizations. 

2. Indirect Measures and Standardized Surveys 

Use established national surveys to provide insights on engagement and performance gaps. Valuable tools include: 

3. Early Mental Health Assessments 

Mental health surveys are highly useful tools to determine if a significant proportion of first-time students feel isolated. Administering these surveys early—ideally during the first 8 weeks of the fall semester—provides a critical window for intervention before a student decides to drop out mid-year. 

Ultimately, measuring belonging is only step one; the most important thing is to take action using the data you have. 

Are you measuring sense of belonging in relation to persistence and retention? Datatelligent can support your efforts to improve retention through mixed methods research with data integration in a secure cloud-space for traditional analytics and AI. Ask about our Fusion platform today! 

References & Further Reading 

  • Dias-Broens, A. S., Meeuwisse, M., & Severiens, S. E. (2024). The definition and measurement of sense of belonging in higher education: A systematic literature review with a special focus on students’ ethnicity and generation status in higher education. Educational Research Review, 45. 
  • Lam, V.W.H., & Webb, C. (2026). Graduate Student Center: An Increased Sense of Belonging for Graduate and Professional. New Directions for Higher Education. 
  • Stickl Haugen, J., Frawley, C., & Bledsoe, K. G. (2025). The Development of the Student Belonging Scale: A Measure of School Belonging. Professional School Counseling, 9, 1-12. 
  • Vincente, S., & Matusovich, H. (2026). Sense of Belonging and Intent to Return in a STEM Internship Program. New Directions for Higher Education. 
Categories
Blog

The Strategic Impact of Higher Education Accreditation Software 

Accreditation is more than just a regulatory hurdle; it’s a critical stamp of approval that validates an institution’s credibility, academic integrity, and funding eligibility. But for many colleges and universities, the accreditation process remains a logistical challenge filled with manual data collection, disjointed spreadsheets, and campus-wide frustration. Enter accreditation software—a technological lifeline designed to transform how institutions prepare for review.  

What is Accreditation Software? 

At its core, accreditation software is a specialized platform that helps educational institutions gather, organize, and analyze the vast amounts of data required by accrediting bodies. Instead of faculty and staff spending hundreds of hours chasing down assessment reports and student outcome metrics across fragmented systems, this technology centralizes the entire evidence-collection process. It creates a single source of truth, ensuring that critical data is accurate, secure, and easily accessible when evaluators come knocking. 

Why Higher Education Accreditation Software Matters Today 

The demands placed on higher ed institutions are more rigorous than ever. As standards evolve, universities are under pressure to provide robust evidence of student success, faculty effectiveness, and operational efficiency. Relying on outdated methods like manual entry or pieced-together point solutions often leads to incomplete data, high margins for error, and low employee morale.  

By implementing dedicated higher education accreditation software, institutions can automate workflows, align curriculum mapping with institutional goals, and generate dynamic reports. This shift not only ensures compliance but also allows faculty to spend less time on administrative paperwork and more time focusing on their primary mission: educating students.  

Streamlining Processes with Accreditation Management Software 

The real value lies in the operational efficiency brought by accreditation management software. These solutions integrate directly with existing Learning Management Systems (LMS) and Student Information Systems (SIS), pulling in real-time data to track outcomes continuously. Rather than scrambling to compile data months before a deadline, administrators can use dynamic dashboards to monitor progress year-round, identifying potential gaps in compliance early on.  

How Datatelligent Solves Accreditation Data Challenges 

While many software platforms focus solely on the workflow of accreditation, the root of the challenge is almost always data fragmentation. This is where Datatelligent steps in. We work with higher education institutions to eliminate data silos, bringing all your disparate data sources into a unified Data Lake powered by Snowflake. Our Datatelligent Platform for Higher Education transforms that harmonized data into clear, interactive analytic solutions—giving your leadership a complete 360-degree view of the student lifecycle.  

Datatelligent has built tailored solutions that have helped countless colleges overcome these exact data reporting and compliance challenges. We understand that organizing institutional data for a major review can feel overwhelming. If your college is staring down a rapidly approaching accreditation deadline and you are struggling to compile the necessary evidence, don’t panic. Contact Datatelligent today for immediate help getting the correct information organized, integrated, and presented to ensure a smooth and successful accreditation process. 

Categories
Blog

Moving from Data to Decisions: Inside Our Latest AI in Higher Ed Webinar Author: Larry Blackburn, CEO of Datatelligent

If you work in higher education, you are already intimately familiar with the pressures of the current landscape. Declining enrollments, the need for financial sustainability, student retention hurdles, and increased demands for operational efficiency are squeezing institutional resources across the board. 

Recently, I had the pleasure of sitting down with our Director of Higher Education Growth, Debbie Phelps, to host a webinar on tackling these exact challenges: AI-Powered Analytics: Accelerating Outcomes with Institutional Intelligence. 

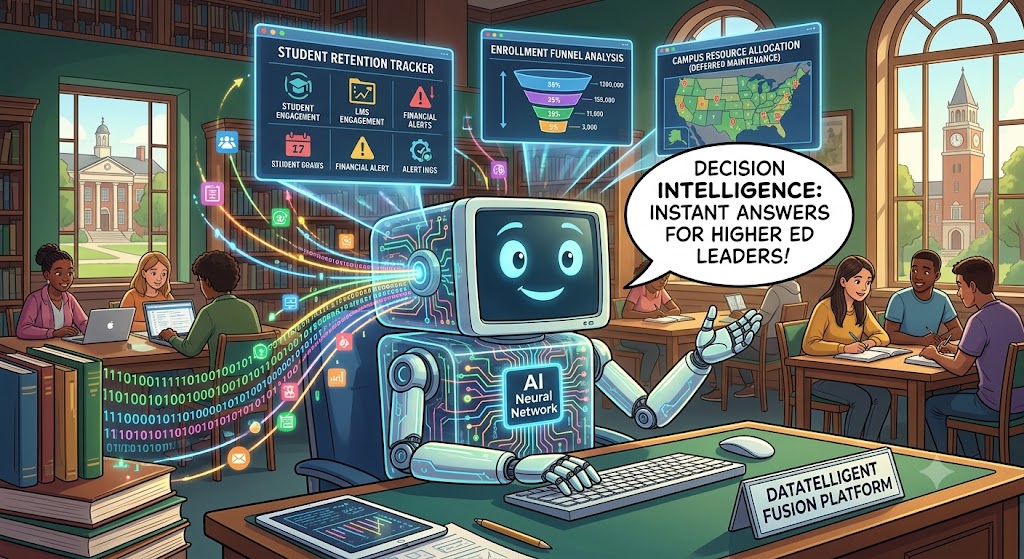
Our core thesis for the event was simple but transformative: The main hurdle in higher ed isn’t a lack of data. Most institutions have plenty of data. The real roadblock is the time it takes to turn that data into answers. By fusing Artificial Intelligence (AI) with Business Intelligence (BI), we can create true decision intelligence—empowering leaders to get conversational answers to their questions exactly when they need them, without waiting on a multi-step reporting queue. 

What We Learned About Higher Ed Using AI 

Throughout the session, we looked at real-world use cases to see exactly how AI is changing the game for colleges and universities. Here are a few key takeaways about how higher ed can actively utilize this technology right now: 

  • Smarter Enrollment Management: AI doesn’t just tell you your headcount is up or down; it tells you why and what to do next. We demonstrated how AI can identify specific bottlenecks in the admissions funnel (such as a drop-off between the applicant and admitted stages) and instantly recommend actions, like prioritizing targeted outreach to keep the funnel moving. 
  • Proactive Student Retention: Predicting dropout risk shouldn’t rely solely on academic capability—it requires identifying structural roadblocks. By analyzing variables like LMS engagement, financial holds, and even a student’s commute distance to campus, AI can bucket students into risk categories. More importantly, it surfaces immediate interventions—like pairing medium-risk students with successful peers or prioritizing TRIO support services—before it’s too late. 
  • Context is Everything: Out-of-the-box AI will fail (and hallucinate) if it doesn’t understand your institution. We discussed the critical importance of Context Engineering—the process of teaching the AI your specific business rules, hierarchies, and metric definitions so that it becomes a reliable, trusted asset. 
  • Operational Efficiency: Beyond the student life cycle, AI is proving invaluable for the business side of higher ed. By combining academic schedules, foot traffic, and inventory data, institutions can proactively manage deferred maintenance and ensure they are allocating resources equitably across all campus locations. 

How Datatelligent Can Help Your Institution 

We know that seeing the potential of AI and actually implementing it on your campus are two very different things. At Datatelligent, we want to meet you wherever you are on your maturity curve. 

If your institution is just starting to explore these concepts, we offer a simple AI for Analytics workshop that we can run with any higher ed team. This is a great way to align your staff, separate the hype from the reality, and understand exactly how AI for Analytics can be securely applied to your specific operational challenges. 

For institutions ready to take the next step, we’ve introduced our Fusion Platform. Built on a secure data cloud foundation, the Fusion platform integrates directly with your existing data to provide a functional, natural-language chatbot experience. Instead of digging through endless dashboards, your leaders can simply type conversational questions into the Fusion chatbot to instantly find valuable data, track strategic KPIs, and uncover the root causes behind your metrics. It’s exactly what it sounds like: a seamless fusion of AI and BI that accelerates your institutional outcomes. 

I encourage you to watch the full webinar above to see these tools in action. If you’re ready to start turning your institutional data into instant decisions, our team is here to help you take that next step. 

Categories
Blog

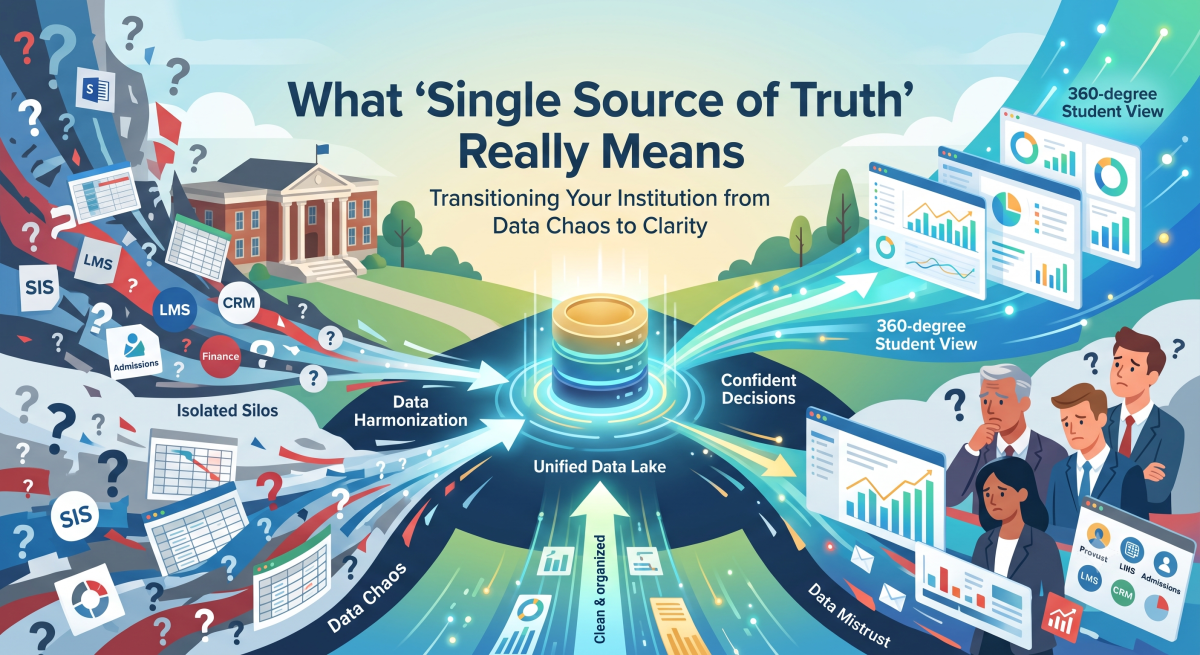
What ‘Single Source of Truth’ Really Means 

We have all been in that executive meeting. The Provost presents one set of enrollment figures, the Admissions Director presents another, and Finance brings a completely different projection. The next hour isn’t spent making strategic decisions — it’s spent dissecting spreadsheets. 

This July, we are focusing on a critical theme: Creating a Single Source of Truth. But to get there, we first have to answer the core question: Why do leaders still argue over whose numbers are right? 

Here is a breakdown of what a single source of truth actually looks like in practice, and how to transition your institution from data chaos to clarity. 

The Core Issue: “We Don’t Trust Our Own Numbers” 

In our recent Office Hours sessions, the most common frustration we hear from institutional leaders is simple: “We don’t trust our own numbers.” 

When data lives in isolated silos, different departments naturally develop their own definitions of success. Admissions pulls a report on a Tuesday, Student Affairs pulls one on a Thursday, and because the systems don’t communicate in real-time, the data doesn’t match. This lack of trust leads to decision paralysis. Leaders end up relying on gut feelings rather than data because verifying the numbers takes too much time and energy. 

A true single source of truth eliminates this friction. It means everyone in the organization — from the President’s cabinet to department chairs — is looking at the exact same, up-to-date data set, defined by the exact same metrics.  

The Solution: Harmonizing SIS, LMS, and CRM Data 

You cannot create a single source of truth without bringing your disparate systems together. In our upcoming Micro-webinar, we will be doing a deep dive into Harmonizing SIS, LMS, and CRM Data. 

When your Student Information System (SIS), Learning Management System (LMS), and Customer Relationship Management (CRM) tools are disconnected, you only get fragmented views of the student lifecycle. Harmonization is the process of extracting that raw data, cleaning it, standardizing it, and weaving it together into a comprehensive, 360-degree view.  

To achieve this at scale, institutions need the right infrastructure. 

The Foundation: A Unified Data Lake 

The cornerstone of this harmonization is the Data Lake. Unlike traditional, rigid databases, a secure, scalable Data Lake acts as the central hub where all institutional data comes together. Data from your campus systems flows seamlessly into this repository in its raw format. It breaks down departmental silos, ensuring that whether you are analyzing financial aid metrics or student engagement, you are pulling from a unified environment.  

The Catalyst: Preset Models 

Simply dumping data into a lake isn’t enough; it has to be organized to make sense for higher education. That is where preset models change the game. By utilizing data models that already define the relationships between higher ed data points (like tying a specific enrollment status to a financial aid tier), the heavy lifting is done for you. Our Fusion Platform leverages these preset models so that AI tools and dashboards can instantly and accurately interpret the data without requiring your IT team to build queries from scratch.  

The Ultimate Outcome: Fewer Conflicting Reports, More Confident Decisions 

As detailed in our latest Outcome brief, the goal of centralizing your data isn’t just better technology — it is operational transformation. 

The true value of a single source of truth is summarized by our core outcome: Fewer conflicting reports, more confident decisions. When your leadership team stops arguing over whose spreadsheet is accurate, you reclaim hours of valuable time. You can move past data validation and step directly into strategy, identifying at-risk students sooner, optimizing resource allocation, and driving institutional success with absolute confidence. 

Categories
Blog

Integrated Student Records: How Higher Ed Unifies Student Data for Better Outcomes

Integrated Student Records: A Guide for Higher Ed Data Leaders

The student data already exists. It’s just scattered across a dozen systems that don’t talk to each other. Here’s how integrated student records fix that — and why they’ve become the foundation of modern student success.

Walk into almost any institution and you’ll find the same problem: a student’s story is split across the SIS, the LMS, the CRM, financial aid, advising notes, and a handful of spreadsheets nobody fully trusts. Each system holds a fragment. None holds the whole. When an advisor, a registrar, or a provost needs a complete picture of a learner, they end up stitching it together by hand — if they can get it at all.

Integrated student records solve that fragmentation by unifying data from every source into a single, reliable, and governed view of each student. This guide explains what integrated student records are, why they matter for retention and enrollment, the challenges of building them, and the practical steps higher education institutions take to get there.

What Are Integrated Student Records?

An integrated student record is a unified, continuously updated profile of a learner that pulls together data from across the institution’s systems — academic, financial, behavioral, and demographic — into one coherent view. Rather than living as disconnected entries in separate platforms, the data is harmonized so that a single record reflects the student’s complete journey.

This is distinct from a single student information system. An integrated data approach sits above and across your existing tools, drawing from each rather than replacing them. The goal is not another silo — it’s a connective layer that makes the systems you already own work together.

Integrated Student Records vs. a Student Information System (SIS)

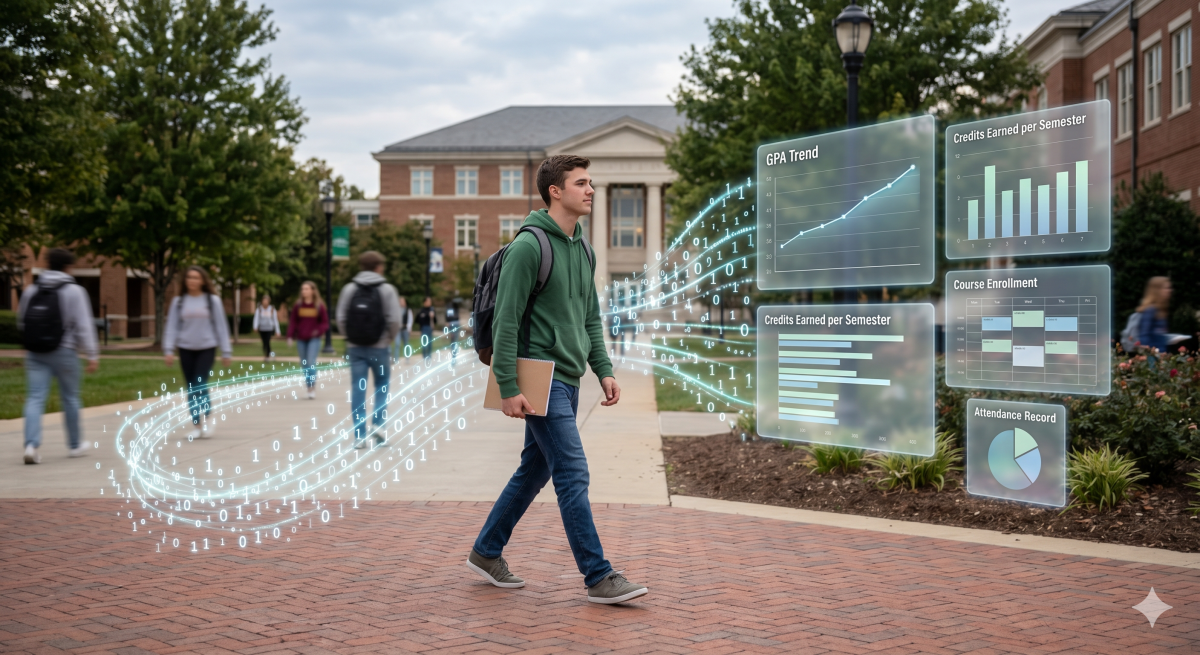
A student information system manages core administrative functions: enrollment, registration, grades, and transcripts. It’s essential infrastructure, but it captures only part of the picture. Integrated student records combine SIS data with information from the learning management system, the CRM, financial aid, and other sources — producing a 360-degree view that no single SIS delivers on its own.

What Data Sources Feed an Integrated Student Record?

A genuinely integrated record draws from the full landscape of campus systems, typically including:

  • Student Information System (SIS): enrollment status, course history, grades, transcripts, and degree progress.
  • Learning Management System (LMS): engagement, assignment submission, participation, and early academic signals.
  • CRM and admissions platforms: recruitment, application, and communication history.
  • Financial aid and student accounts: aid packages, balances, and holds that influence persistence.
  • Advising, retention, and co-curricular systems: notes, interventions, and engagement beyond the classroom.

When these flow together, the institution gains a continuous, historical view of each learner — one that can be looked at day by day rather than as a single annual snapshot.

Why Integrated Student Records Matter for Higher Education

The case for unifying student data goes well beyond convenience. Fragmented data quietly undermines nearly every strategic priority an institution holds — from retention to enrollment to compliance.

Improving Retention and Student Success

The earliest signals that a student is struggling rarely show up in a single system. A dip in LMS engagement, a financial hold, and a missed advising appointment each look minor in isolation — but together they form a clear at-risk pattern. Integrated student records make those patterns visible early enough to act, allowing advisors and success teams to intervene before a student disengages entirely.

Powering Smarter Enrollment and Recruitment

Enrollment teams need to understand not just who applied, but how today’s prospects compare to the students who succeeded in the past. Connecting recruitment data to outcomes data turns guesswork into strategy. Our work on AI-powered enrollment platforms for colleges shows how unified data feeds predictive models that sharpen recruiting and yield decisions.

Reducing Reporting Burden and Manual Work

When data lives in disconnected systems, every report — IPEDS, Title IV, accreditation, board updates — becomes a manual reconciliation project. Integrated student records establish a single source of truth, dramatically cutting the time staff spend pulling, cleaning, and matching data by hand. Many institutions find this alone justifies the investment.

Protecting Student Privacy and Maintaining FERPA Compliance

Unifying data does not mean exposing it. A well-designed integrated record is governed: access is role-based, sensitive fields are protected, and the system is built to support FERPA compliance rather than complicate it. Strong data harmonization and governance ensure the right people see the right data — and no one sees what they shouldn’t.

The Challenges of Building Integrated Student Records

If integration were easy, every institution would already have it. The obstacles are real, but each is solvable with the right approach.

Data Silos and Incompatible Systems

Campus systems are rarely designed to share data. The SIS, LMS, and CRM each store information in their own structure, with their own definitions and identifiers. Bridging them requires both technical pipelines and a shared understanding of what the data means.

Inconsistent Definitions and Data Quality

Does “enrolled” mean the same thing in the SIS as it does in the financial aid system? Often, no. Different departments define the same terms differently, and small inconsistencies compound into untrustworthy reports. Harmonizing definitions across the institution is as much a governance challenge as a technical one.

Limited Internal Resources

Many institutions simply don’t have a large data engineering team. Building and maintaining integration pipelines, a data lake, and a governed model in-house is a heavy lift. This is where a managed approach — handled by a dedicated data team — lets institutions get integrated records without hiring an entire department.

How to Build Integrated Student Records: A Practical Framework

Creating integrated student records is a sequence of well-understood steps. The path looks consistent across institutions, even as the details vary.

Step 1: Collect Data From Every Source

The foundation is reliable data movement. Automated flows pull data from the SIS, LMS, CRM, financial aid, and other systems into a central location, ensuring information arrives consistently and on schedule. Datatelligent’s Data Flows automate this ingestion so source data lands reliably without manual exports.

Step 2: Centralize in a Unified Data Lake

Once collected, data needs a home that can hold history and scale across sources. A unified data lake stores raw and processed data together, preserving the day-by-day history that makes trend analysis and longitudinal tracking possible.

Step 3: Harmonize and Govern the Data

Centralized data still isn’t integrated until it’s harmonized — aligned to consistent definitions, cleaned, deduplicated, and governed with appropriate access controls. This is the step that turns a pile of source data into a trustworthy, unified student record.

Step 4: Turn Records Into Insights

With clean, integrated records in place, institutions can layer on intelligent insights — dashboards, predictive models, and AI — to flag at-risk students, forecast enrollment, and measure outcomes across the entire student lifecycle.

From Fragmented Data to a Unified Student View

Integrated student records aren’t a single product you buy off a shelf — they’re the result of connecting collection, centralization, harmonization, and insight into one continuous system. Done well, they transform student data from a reporting headache into the institution’s most valuable strategic asset.

Datatelligent’s Fusion Platform for Higher Education was built for exactly this: collecting and harmonizing data from across your campus systems to deliver insights across the entire student lifecycle. If your institution is ready to move from scattered systems to a single, trusted view of every student, talk with our team about where to start.

Frequently Asked Questions About Integrated Student Records

What is the difference between integrated student records and a student information system?

A student information system manages core functions like enrollment, grades, and transcripts. Integrated student records combine SIS data with information from the LMS, CRM, financial aid, and other systems to create a single, complete view of each student that no individual SIS provides alone.

Do integrated student records replace our existing systems?

No. Integration sits across the systems you already own, drawing data from each rather than replacing them. Your SIS, LMS, and CRM stay in place; the integrated record connects them.

Are integrated student records FERPA compliant?

They can and should be. A properly designed integrated record uses role-based access and governance to protect sensitive data, supporting FERPA compliance rather than putting it at risk.

How long does it take to build integrated student records?

Timelines vary with the number of source systems and the state of your existing data, but a managed, phased approach lets institutions see value early — often starting with high-priority data sources and expanding from there.

Categories
Blog

Maximizing Admissions: The Ultimate Guide to AI-Powered Enrollment Platforms for Colleges 

The landscape of college admissions is shifting rapidly, and institutions are increasingly turning to advanced data solutions to stay competitive. At the forefront of this shift are ai-powered enrollment platforms for colleges. 

But what exactly are these platforms? In higher education, an AI-powered enrollment system is a comprehensive, intelligent data ecosystem that leverages machine learning and predictive analytics to streamline the entire student admissions journey—from the first inquiry to the last day of classes. Rather than simply acting as a digital filing cabinet, these platforms actively analyze applicant data, automate routine outreach, predict enrollment likelihood, and personalize the prospect experience at scale. 

Empowering the Admissions Office: Who Uses These Tools? 

To get the most out of predictive modeling and automation, it’s essential to understand who interacts with these platforms daily and how they can best be utilized. 

Admissions Counselors and Recruiters 

The primary users of ai-powered enrollment tools for admissions staff are the counselors on the front lines. Historically, these professionals have spent countless hours answering routine questions, manually logging emails, and sorting through unqualified leads. 

When implemented correctly, ai-driven enrollment platforms support admissions staff high-yield activities. By delegating the repetitive tasks (like initial chatbot conversations or automated document reminders) to the AI, counselors can dedicate their time to high-value interactions: conducting personal campus tours, having meaningful one-on-one conversations with prospective students, and closing the gap on yield rates. 

Enrollment Leadership and Deans 

For Directors of Admissions and VPs of Enrollment Management, these platforms act as the ultimate strategic dashboard. Leaders use the AI’s predictive modeling to forecast class sizes, track the health of the admissions funnel, and allocate marketing budgets more effectively. To get the best results, leadership should focus heavily on ai enrollment workflows customization, ensuring the AI’s scoring models are trained specifically on the institution’s historical enrollment patterns rather than generic industry averages. 

Finding the Right Fit for Every Campus 

Advanced capabilities aren’t just for large universities. In fact, some of the best ai-powered enrollment systems for small colleges provide immense value by acting as a force multiplier for leaner teams, allowing them to provide a highly personalized touch to their applicant pool without needing to double their headcount. 

Scale and Strategy: Small Colleges vs. Large Universities 

While the underlying technology is the same, how it’s deployed depends on the size of your campus. Both require AI to stay competitive, but for different strategic reasons: 

  • Small Colleges (The Force Multiplier): With leaner teams, small schools use AI to ensure no inquiry is missed. It automates administrative tasks so staff can focus on their greatest competitive advantage: deep, personal relationships with every applicant. 
  • Large Universities (The Data Navigator): For institutions managing massive applicant pools, AI provides essential triage. It scores thousands of files instantly and routes data across complex departments, ensuring high-yield prospects don’t get lost in the digital noise. 

Whether you are scaling a personal touch or managing a data deluge, specialized ai enrollment workflows customization ensures the platform serves your specific mission. 

The Key to Success: Eliminating Data Silos 

The greatest AI tool in the world is useless if it cannot communicate with the rest of your campus technology. Seamless ai-powered enrollment platforms integration with student information systems (SIS) is the critical bridge that makes these tools work. 

When your enrollment AI and your SIS speak the same language, admissions teams can ensure a single, accurate source of truth. As soon as an applicant submits an application, that information automatically updates in the SIS, triggering financial aid packaging, housing assignments, and course registration workflows without manual data entry. 

Giving Data a Voice with Datatelligent’s Fusion Platform 

For institutions looking to adopt a true higher-education-first data strategy, solving the complex web of integrations, dashboards, and automated information pulling can be daunting. That is where Datatelligent steps in. 

Our Fusion Platform is purpose-built for higher education, designed to break down departmental silos and turn raw admissions data into actionable, predictive insights. Whether you need to connect a fragmented SIS, build intuitive enrollment dashboards for your leadership team, or deploy custom machine learning models to predict student melt, the Fusion Platform handles the heavy lifting. 

We ensure that your enrollment workflows are highly customized and fully integrated, empowering your staff to focus on what they do best: building relationships with future students. 

Ready to transform your admissions process? Learn more about how our AI models and solutions can integrate with your enrollment ecosystem and drive your institution’s growth. 

Categories
Blog

Grant Data Without the Spreadsheet Nightmare

Higher education institutions are pursuing more grants than ever before. Federal funding cuts. State budget pressure. A growing mandate to diversify revenue streams. The result is a grants landscape that keeps expanding, with more sources, more compliance requirements, more reporting timelines, and more stakeholders trying to manage it all.

The problem is that most institutions are managing this growing complexity the same way they always have. Spreadsheets. Shared drives. Email threads tracking deliverables. A grants manager who holds the full picture in their head because no system does it for them.

That approach worked when your institution had two or three active grants. It does not work when you have twelve, and the stakes keep getting higher.

The Grants Landscape Has Changed. The Infrastructure Hasn’t.

According to Inside Higher Ed’s 2025 survey, Chief Academic Officers are increasingly concerned about diversifying funding streams amid federal and state funding uncertainty. That concern is showing up in grant activity at institutions across the country, as development and academic teams pursue more external funding to offset what they can no longer count on from traditional sources.

But diversifying grant funding isn’t just a development challenge. It’s an operational one.

Every new grant award brings its own reporting timeline, budget categories, compliance expectations, and relationship with a funder who expects accurate, timely information. Multiply that across a growing portfolio, and you have a coordination problem that no spreadsheet was designed to solve.

The staff expected to manage that complexity haven’t grown with it. CAOs and CFOs in the same IHE survey consistently flagged capacity as a top constraint. More grants, same team, higher stakes. That’s the operating reality for a lot of institutions right now.

The Hidden Cost of Grant Data Chaos

When grant data lives in disconnected places, the day-to-day operational costs are evident. Staff spend hours reconciling budget actuals from the finance system against what the grants office is tracking. Program directors submit their parts of the report, and someone else stitches it together manually. A deadline approaches, and the person with the master spreadsheet is out sick.

But the deeper cost is less visible and more serious.

Compliance risk compounds quietly. A missed carryover deadline. An expenditure coded to the wrong fund. A budget modification that wasn’t formally reported to the funder. None of these feels catastrophic in isolation. Together, they create exposure that can damage relationships with funders and jeopardize future awards.

And when leadership asks how the grants portfolio is performing overall, or whether the institution is on track across all active awards, the honest answer is often: we’re not entirely sure. We’d have to pull it together.

That’s not a staffing failure. It’s an infrastructure problem.

What Grant Data Visibility Actually Makes Possible

The goal isn’t to replace every spreadsheet overnight. The goal is to stop relying on spreadsheets as the connective tissue between systems that should already be sharing data.

When grant data is unified into a structured, accessible environment, a few important things change.

Budget actuals stay current without manual reconciliation against finance system records. Reporting timelines and deliverable dates are visible to the whole team, not just the person who built the tracker. Leadership can see the grants portfolio at a glance, understanding how the full picture looks rather than reviewing individual awards in isolation.

Just as importantly, the institution gains a clearer line of sight into grant performance over time. Which programs are being supported by external funding? Where are the budget variances showing up? Are there patterns in which grant types the institution consistently manages well, and where the friction tends to concentrate?

That kind of visibility doesn’t just reduce risk. It makes the institution a more credible steward in the eyes of funders, which matters when renewals and new awards are on the table.

Grant Complexity Isn’t Going Away

The pressure to diversify funding is not a short-term condition. It reflects a structural shift in how higher education is being asked to sustain itself, and institutions that build the operational infrastructure to manage grant complexity effectively will be better positioned than those still relying on heroic individual effort to keep everything together.

That’s not about adding more tools. It’s about connecting the data that already exists across finance, academic units, and the grants office into a picture that leadership can actually see and act on.

At Datatelligent, the Fusion Platform is built to do exactly that, bringing together institutional data across systems and making it visible, connected, and actionable.

When grant data is part of a unified environment, institutions stop scrambling before every reporting deadline and start managing their portfolios with the confidence that comes from actually knowing what’s happening.

The grants manager holding everything together in a spreadsheet is doing remarkable work. They deserve infrastructure that works as hard as they do.

Latest News
Days
Hours
Minutes