Labor is the single largest financial commitment on any college or university campus, consistently accounting for 65% to 75% of total operating expenditures. Yet when enrollment headwinds, tuition discounting pressures, or inflation tighten institutional margins, many leadership teams still rely on blunt instruments—hiring freezes, across-the-board departmental cuts, or deferred backfills—to balance the budget.
Across-the-board cuts rarely solve structural deficits. Instead, they starve high-growth, high-margin academic programs while leaving underutilized instructional capacity and administrative bloat untouched.
To protect academic quality while restoring fiscal health, Chief Financial Officers (CFOs) and Institutional Research (IR) leaders are turning to rigorous labor cost benchmarking. By connecting payroll and benefits actuals with instructional workload, student credit hours, and external peer datasets, institutions can move past gut-feel budgeting and make defensible, mission-aligned resource decisions.
Why Labor Cost Benchmarking for Educational Institutions Is Different
Applying standard corporate workforce metrics to a college or university almost always backfires. Effective labor cost benchmarking for educational institutions requires accounting for structural realities that do not exist in the private sector:
Academic Tenure and Shared Governance: Instructional labor is not a variable cost that can be adjusted quarter by quarter. Multi-year contract obligations, tenure lines, and accreditation mandates for terminal-degree faculty create high fixed-cost floors.
Complex Effort Splits: A single faculty member’s compensation may be split across classroom instruction, departmental administration (such as program chair duties or course releases), institutional service, and externally funded grant research.
Divergent Contract Structures: Campuses manage a complex mix of 9-month and 12-month faculty appointments, per-course adjunct stipends, graduate assistantships, unionized staff, and auxiliary enterprise employees.
The Finance vs. IR Data Divide: On most campuses, the Finance office views labor through the General Ledger (GL) and ERP—tracking budget-to-actuals, fringe benefit pools, and vacant position encumbrances. Meanwhile, Institutional Research views labor through census snapshots, IPEDS human resources classifications, and Student Information System (SIS) course sections.
When Finance and IR operate in separate spreadsheets, leadership ends up debating whose numbers are right rather than deciding where to invest. Bridging those two perspectives is the foundation of strategic benchmarking.
The Core Pillars of Higher Education Salary Benchmarking and Instructional Cost Analysis
No single dataset tells the whole story of campus labor efficiency. High-performing finance and IR teams triangulate three primary external benchmarking sources alongside their internal operational data.
Compensation and Staffing Ratios with CUPA-HR Salary Data
When evaluating market competitiveness and compensation equity, CUPA-HR salary data (College and University Professional Association for Human Resources) is the gold standard for higher education salary benchmarking.
CUPA-HR surveys allow institutions to benchmark salaries across administrator, professional, staff, and faculty roles—segmented by faculty rank (Professor, Associate, Assistant, Instructor) and 4-digit CIP (Classification of Instructional Programs) discipline codes. Rather than guessing whether a computer science or nursing faculty line requires a market premium, CFOs and HR leaders can compare institutional medians directly against custom peer groups by operating budget, enrollment size, and classification.
Beyond base pay, mature benchmarking teams use CUPA-HR data to analyze:
Position distribution ratios: Comparing administrative and professional staff FTEs per 1,000 students against peer medians to identify top-heavy overhead structures.
Pay compression and equity: Identifying where long-tenured faculty or staff have fallen behind market rates relative to new hires.
Instructional Productivity and the Delaware Cost Study
While salary surveys explain what you pay per person, they do not measure instructional productivity. That is where the Delaware Cost Study (formally the National Study of Instructional Costs and Productivity) becomes indispensable.
Operating at the academic discipline level (CIP code), the Delaware Cost Study enables institutions to benchmark:
Direct instructional expense per student credit hour (SCH) taught: Comparing the actual labor and departmental operating cost of delivering a credit hour in Biology, Business, or English against national and Carnegie peers.
Faculty teaching loads by category: Breaking down the proportion of undergraduate and graduate credit hours generated by tenured/tenure-track faculty, full-time non-tenure-track faculty, part-time/adjunct instructors, and teaching assistants.
Class size and section efficiency: Revealing whether high instructional costs in a department are driven by above-market salaries or by small section sizes and under-enrolled upper-division courses.
Federal Baselines via IPEDS Finance and Human Resources Surveys
The Integrated Postsecondary Education Data System (IPEDS) provides a universal, publicly available baseline for macro-level labor cost benchmarking. By pulling IPEDS Finance and Human Resources survey data, IR teams can evaluate functional expense allocations:
Instructional vs. Non-Instructional Spend: Benchmarking what percentage of total core expenses goes toward Instruction versus Academic Support, Student Services, and Institutional Support (central administration).
Full-Time Equivalent (FTE) Staffing Trends: Tracking multi-year shifts in faculty-to-administrator ratios across peer cohorts.
While IPEDS is essential for board-level context, its 12-to-24-month reporting lag and broad functional categories mean it must be paired with granular internal data and discipline-level benchmarks to drive operational decisions.
Calculating True Cost Per Credit Hour and Program-Level Margin
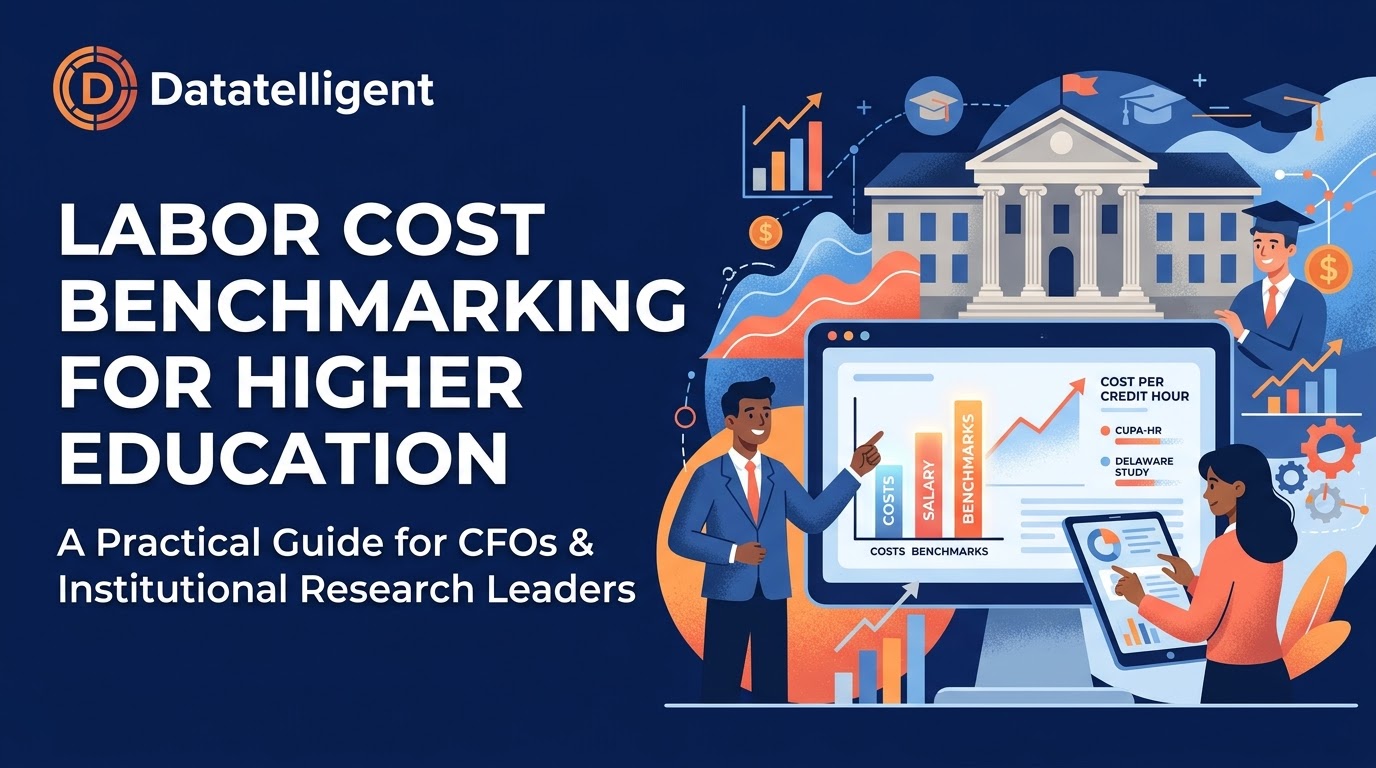
For CFOs and Provosts, the ultimate bridge between labor benchmarking and budget strategy is cost per credit hour. Knowing that your institution spends an average of $310 per credit hour campus-wide is rarely actionable; knowing that one program spends $185 per credit hour with a 92% course fill rate while another spends $640 per credit hour with a 48% fill rate changes how you allocate faculty lines.
To calculate an accurate, decision-ready cost per credit hour, institutions must connect three layers of data:
Direct Instructional Labor Cost: Base salary plus actual fringe benefits (healthcare, retirement contributions, tuition remission, payroll taxes) for every instructor of record, allocated proportionally to the credit hours of each course section taught.
Unallocated Faculty Time and Release Cost: Accounting for reassigned time—such as department chair stipends, accreditation coordination, advising loads, or unfunded research releases—so those costs are transparently attributed to the department or program rather than hidden in a general pool.
Indirect Academic and Institutional Overhead: Applying a consistent methodology to layer in dean’s office administration, academic advising, and student support costs when calculating full cost per degree awarded.
| Benchmarking Metric | Core Formula | Primary Data Sources | Strategic Question Answered |
| Direct Instructional Cost per Credit Hour | $\frac{\text{Total Instructional Salary + Fringe}}{\text{Total Student Credit Hours (SCH) Generated}}$ | HRIS/Payroll, GL, SIS, Delaware Cost Study | How efficiently does each department deliver classroom instruction compared to discipline peers? |
| Median Salary to Peer Market Ratio (Compa-Ratio) | $\frac{\text{Institutional Median Salary by CIP/Role}}{\text{Peer Group Median Salary}}$ | HRIS, CUPA-HR Salary Data | Are we overpaying or risking turnover in high-demand academic and administrative roles? |
| Instructional vs. Administrative Labor Ratio | $\frac{\text{Instructional Compensation + Benefits}}{\text{Institutional Support Compensation + Benefits}}$ | ERP/GL, IPEDS Finance & HR | Is administrative overhead growing faster than our core academic investment? |
| Net Program Contribution Margin per SCH | $\text{Net Tuition Revenue per SCH} – \text{Direct Cost per Credit Hour}$ | SIS, Financial Aid, GL/Payroll | Which academic programs subsidize the institution, and which require structural redesign? |
A 4-Step Framework for Effective Labor Cost Benchmarking
Building a sustainable benchmarking practice requires collaboration between Finance, Institutional Research, Human Resources, and Academic Affairs.
1. Build a Defensible Peer Group
Benchmarking fails immediately if Deans and Faculty Senate leaders reject the peer group. Move beyond “aspirational peers” and construct three distinct cohorts:
Current Structural Peers: Institutions matching your Carnegie Classification, enrollment size, public/private control, unionization status, and regional cost of living.
Program-Mix Peers: Campuses with a similar distribution of high-cost programs (e.g., allied health, engineering, fine arts) versus lower-cost lecture programs.
Financial Viability Peers: Institutions achieving top-quartile student retention and operating margins within your sector.
2. Reconcile ERP, HRIS, and SIS Data Definitions
The biggest technical hurdle in labor cost benchmarking for educational institutions is entity resolution across campus systems. A faculty member’s payroll record lives in the ERP/HRIS, while their teaching load lives in the SIS.
Before running benchmarks, Finance and IR must establish governed data definitions:
How are cross-listed courses and team-taught sections credited?
How are summer and intersession stipends treated relative to academic-year base pay?
Are fringe benefits applied using an actual employee-by-employee calculation or a blended institutional fringe rate?
3. Normalize for Discipline Mix and Delivery Modality
Comparing the cost per credit hour of a clinical nursing cohort (which requires an 8:1 student-to-faculty ratio by state board mandate) to an introductory psychology lecture will always make nursing look expensive. Always normalize internal labor costs against discipline-specific benchmarks from the Delaware Cost Study and CUPA-HR salary data, and segment online, hybrid, and on-ground modalities separately.
4. Pair Cost Benchmarks with Student Outcomes and Net Tuition Revenue
Cost efficiency means nothing if it erodes student retention. A department that lowers its cost per credit hour by replacing full-time faculty with under-supported adjuncts in gateway courses may inadvertently trigger a 10% drop in first-to-second-year retention—costing the institution far more in lost net tuition revenue than it saved in payroll. Always evaluate labor cost metrics alongside DFW rates (D, F, and Withdrawal grades), course completion, and degree velocity.
Using Financial Intelligence in Higher Education to Benchmark Labor Cost Continuously
For decades, campus benchmarking was a static, backward-looking exercise. An IR analyst or finance director would spend six weeks pulling CSV exports from the ERP and SIS, manually VLOOKUP-ing IPEDS and CUPA-HR tables in Excel, and presenting a slide deck to the cabinet months after the fiscal year closed. By the time leadership saw the data, faculty contracts for the next academic year were already signed.
Today, forward-thinking CFOs and IR leaders are deploying financial intelligence in higher education to benchmark labor cost dynamically throughout the budget cycle. Instead of treating benchmarking as a once-a-year compliance report, automated financial intelligence connects live operational data with external peer benchmarks so leaders can run proactive scenarios:
Vacancy and Line-Reallocation Modeling: When a tenured faculty member retires, leadership can immediately view the department’s SCH trends, section fill rates, and Delaware Cost Study ratios to decide whether to refill the tenure line, convert it to an instructional track, or reallocate the line to a growing program with a waitlist.
Adjunct vs. Overload Optimization: Tracking when departmental reliance on faculty overloads or part-time stipends crosses the financial threshold where hiring a full-time lecturer reduces cost per credit hour and improves student outcomes.
Course Cap and Section Consolidation: Identifying low-enrollment course sections before registration closes, quantifying the exact instructional labor savings of consolidating three 12-student sections into two 18-student sections.
How Datatelligent Helps Finance and IR Teams Turn Labor Data into Strategic Action
Most CFOs and Institutional Research leaders don’t lack frameworks—they lack unified, trustworthy data. When your General Ledger, HR/Payroll system, Student Information System, and external datasets (IPEDS, CUPA-HR salary data, and the Delaware Cost Study) live in disconnected silos, your smartest analysts spend 80% of their time reconciling spreadsheets instead of advising leadership.
Datatelligent was built specifically to eliminate that bottleneck for higher education.
Through our Fusion Platform and Data Analytics as a Service (DAaaS) model, Datatelligent integrates your campus ERP, HRIS, SIS, and national benchmarking datasets into a single, governed data warehouse—complete with interactive dashboards designed for Provosts, CFOs, and IR directors.
With Datatelligent, your institution can:
Automate Cross-System Data Integration: Seamlessly connect payroll actuals, benefit loads, and position control with SIS course sections and credit hours—eliminating manual spreadsheet reconciliation between Finance and IR.
Visualize Cost Per Credit Hour & Program ROI: Drill down from macro institutional expenses to college, department, CIP discipline, and individual course section margins in seconds.
Benchmark Against Custom Peer Cohorts: Layer IPEDS, CUPA-HR, and instructional productivity benchmarks directly alongside your internal trends to spot compensation inequities, administrative bloat, and instructional bottlenecks early.
Scale Without Adding Technical Headcount: Our Data Team as a Service (DTaaS) approach gives your campus dedicated higher-ed data engineers and analytics specialists who build, maintain, and govern your pipelines—accelerating your transition to a truly Data Informed institution at a fraction of the cost of hiring an internal team.
Ready to move from reactive budget cuts to proactive financial intelligence in higher education to benchmark labor cost? Contact Datatelligent today to schedule a personalized demo and see how our higher education analytics solutions can bring clarity to your campus labor strategy.